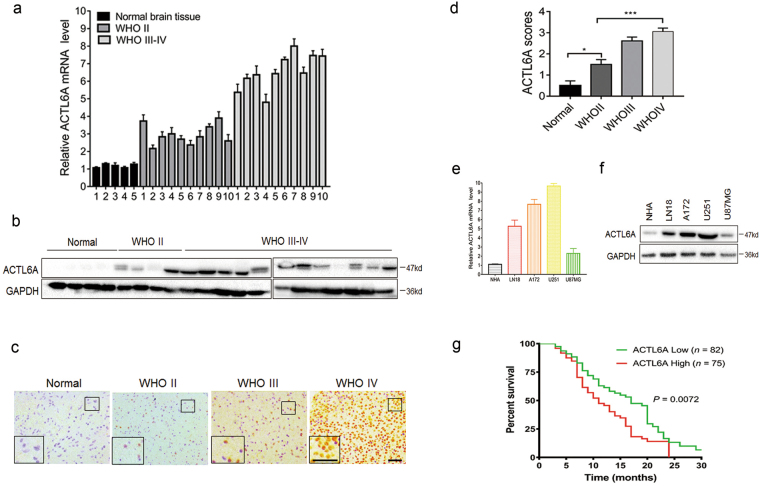
Fig. 1. ACTL6A is overexpressed in glioma patient samples and cell lines.
a qRT-PCR performed on primary human glioma (n = 20; WHO grade II–IV) and non-neoplastic (n = 5) tissue samples. Data are represented as the mean ± SEM. b Western blot analysis of ACTL6A levels in lysates prepared from different grades of human gliomas (WHO grades II–IV) and normal brain tissues. c Representative images of IHC staining of ACTL6A in human glioma and non-neoplastic tissue samples. Scale bars, 100 µm. d Graphical representation of scoring performed on IHC staining of glioma and non-neoplastic tissue samples for ACTL6A. Data are represented as the mean ± SEM. e, f qRT-PCR and western blot analysis of ACTL6A levels in NHA, LN18, A172, U251, and U87MG cell lines. GAPDH was used as a loading control. g Kaplan–Meier survival analysis performed with survival data of glioma patients with high ACTL6A expression (n = 75) vs. low ACTL6A expression (n = 82). Log-rank test, P = 0.0072. Student’s t-test: *P < 0.05, ***P < 0.001

