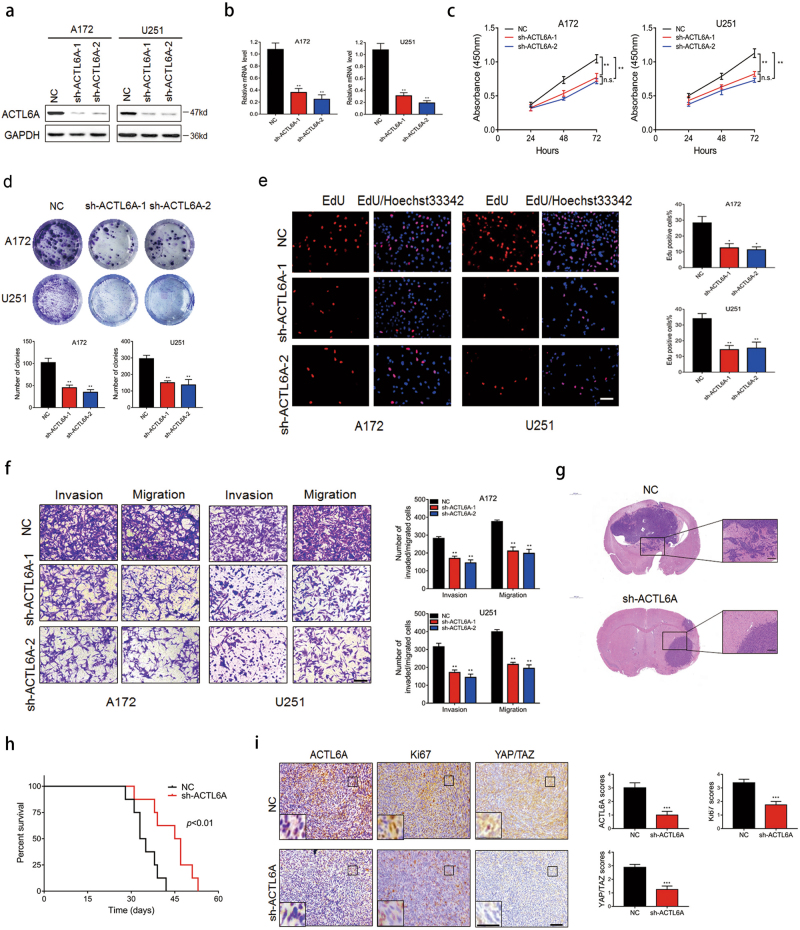
Fig. 2. Knockdown of ACTL6A inhibits proliferation, migration and invasion of glioma cells in vitro and in vivo.
A172 and U251 cells were infected with ACTL6A shRNAs and knockdown efficiency was determined by both a western blotting and b qRT-PCR. Data are represented as the mean ± SEM. c A172 and U251 cells were infected, and cell viability was analyzed by CCK8 assay. Data are represented as the mean ± SEM. d EdU assay for modified A172 and U251 cells. Graphic representation of EdU-positive cells in A172- and U251-NC, sh-ACTL6A-1, and sh-ACTL6A-2 cells. Data are represented as the mean ± SEM. Scale bars, 100 µm. e Representative images of colony-forming assay for modified A172 and U251 cells. Cells were fixed and stained, colonies were counted, and results are represented in the bar graph. Data are represented as the mean ± SEM. f Representative images of fixed and stained transwell migration and invasion assays performed on modified A172 and U251 cells. Graphic representation of migrated and invaded cells counts from transwell assay. Data are represented as the mean ± SEM from three independent experiments. Scale bars, 100 µm. g Representative HE staining of orthotopic xenografts from U251-NC and -sh-ACTL6A groups. Scale bars, 1000 µm, 200 µm. h Kaplan–Meier survival analysis performed with survival data of mice implanted with U251-NC and -sh-ACTL6A cells. Log-rank test, P < 0.01. i Representative images of IHC staining of ACTL6A, Ki67, YAP/TAZ levels in xenograft sections from NC and sh-ACTL6A group. Graphic representation of IHC scoring of ACTL6A, Ki67, YAP/TAZ levels in xenograft sections from indicated group. Data are represented as the mean ± SEM. Scale bars, 100 µm. Student’s t-test: n.s. = not significant, *P < 0.05, **P < 0.01, ***P < 0.001

