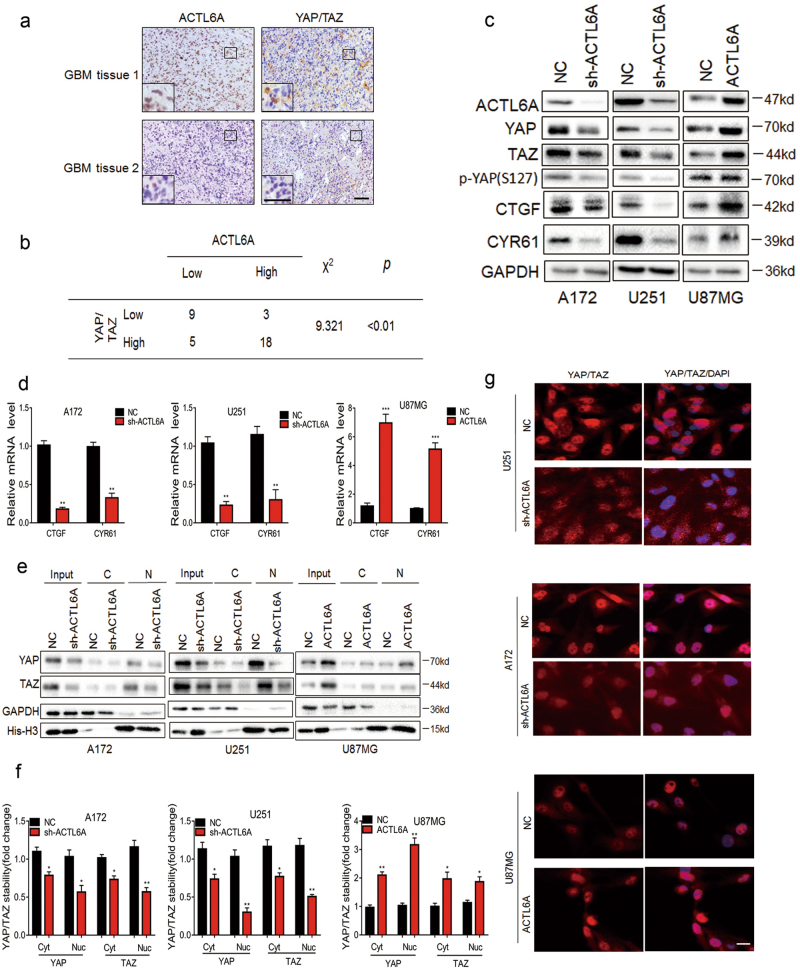
Fig. 4. ACTL6A expression increases YA-P/TAZ protein levels and influences their cellular distribution.
a Representative images of IHC staining of ACTL6A and YAP/TAZ in primary human glioma tissues. Scale bars, 100 µm. b Association of ACTL6A expression with YAP/TAZ expression in primary human glioma samples. IHC scores are indicated in parentheses. χ2-test, P < 0.01. c Western blot analysis to evaluate YAP/TAZ, their downstream target genes CTGF and CYR61, and YAP phosphorylation in lysates prepared from modified cell lines A172- and U251-NC, -sh-ACTL6A, and U87MG-NC and -ACTL6A. GAPDH was used as loading control. d qRT-PCR analysis of CTGF and CYR61 in modified A172, U251, and U87MG cells. Relative expression is shown over GAPDH mRNA. Data are represented as the mean ± SEM. e Western blot analysis of cytoplasmic (C) and nuclear (N) fractions prepared from indicated cells. f Graph showing the mean YAP and TAZ levels normalized to cytoplasmic (GAPDH) and nuclear (Histone-H3) markers, and then to NC cells. Data are represented as the mean ± SEM. g Immunofluorescence of YAP/TAZ in modified A172, U251, and U87MG cells showing cellular localization. Scale bars, 100 µm. Student’s t-test: *P < 0.05, **P < 0.01, ***P < 0.001

