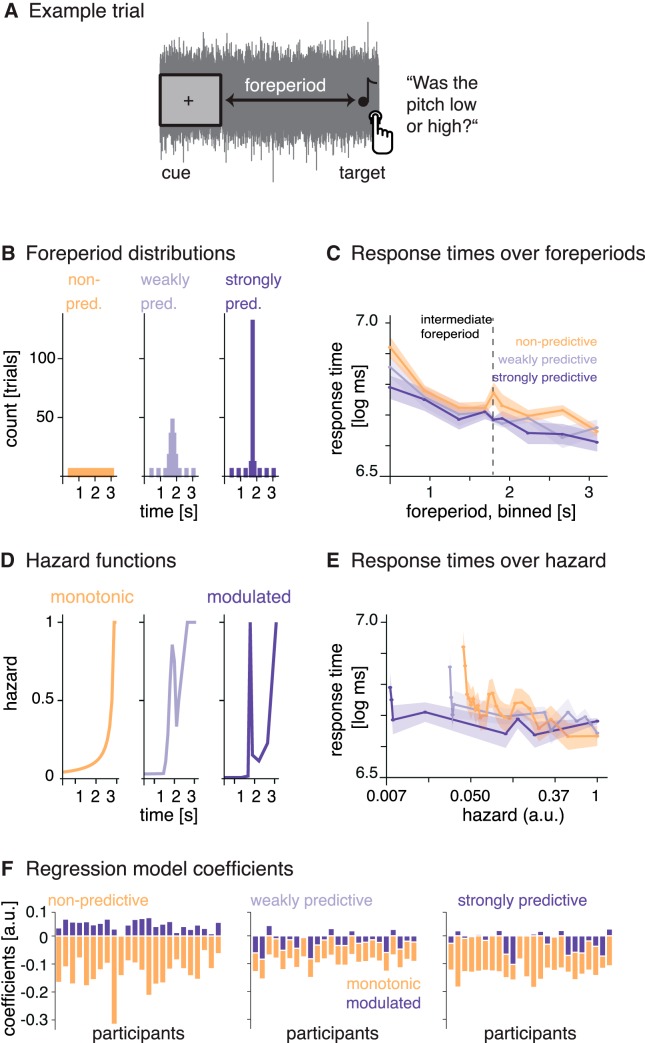
Figure 1.
Paradigm and response times. A, Example trial. On each trial, the simultaneous onset of the fixation cross and the noise served as a temporal cue. After a variable foreperiod interval, a single target tone was presented and participants had to judge its pitch as low or high. B, Foreperiod probability distributions. Foreperiods for each block were drawn from one of three distributions: a uniform distribution (nonpredictive) and two normal distributions with larger and smaller standard deviations (weakly and strongly predictive). C, Response times over foreperiods (binned): response times were longer at short foreperiods and shorter at long foreperiods. D, Hazard functions resulting from the foreperiod probability distributions. E, Response times over temporal hazard (i.e., the value of the hazard function at the time of target onset, on a log-spaced axis): response times were longest at the lowest hazard. Shaded surfaces reflect SEM. F, Relative regression coefficients per participant obtained by modeling response times per condition (panels from left to right) with the monotonic and modulated hazard functions as regressors.

