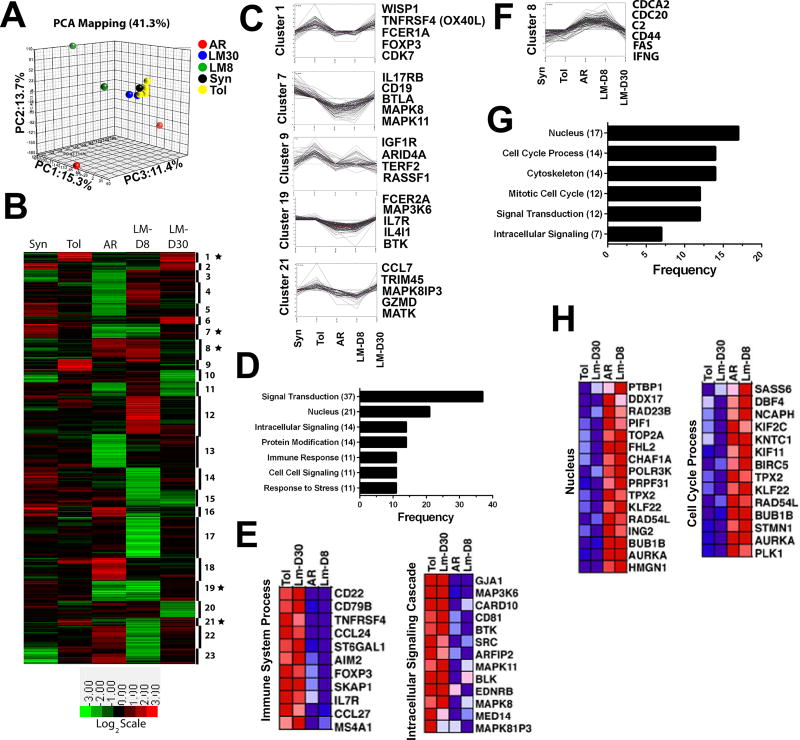
Figure 2.
Microarray analysis of graft infiltrating cells from tolerant and rejecting heart grafts is consistent with a restoration of tolerance at day 30 post-Listeria infection. RNA was isolated from pooled CD45+ graft-infiltrating cells syngeneic (Syn; 0.6 × 10⁴/graft; 5 grafts pooled, n=1), tolerant (Tol; 2.5 × 10⁴/graft; 10 grafts pooled, n=4), acutely rejecting (AR; 11.5 × 10⁴/graft; 4 grafts pooled, n=2), Listeria-infected tolerance d8 (Lm-D8; 6.2 × 10⁴/graft; 4 grafts, n=3), and restored tolerance (Lm-D30; 5.3 × 10⁴/graft; 4 pooled, n=2) mice and microarray analysis was performed. (A) Principal component analysis (PCA) revealed 41.3% of the total variation within the first 3 components. (B) Genes with significant differential expression were analyzed using K-means clustering in 23 clusters. Gene expression is median-centered at the probe level; higher expression is shown in red. The star symbol indicates the clusters associated with tolerance or rejection. (C-E) Genes of interest are shown from clusters, frequency of genes associated with selected Gene Ontology terms and heat map of gene expression wherein expression of genes associated with tolerance (i.e., higher in tolerant and Lm-D30 CD45+ GIC) were enriched compared to acutely rejecting and Lm-D8 mice. (F-H) Genes of interest are shown from clusters, frequency of genes associated with selected Gene Ontology terms and heat map of gene expression wherein expression of genes associated with acute rejection or loss of tolerance (Lm-D8) were distinct from tolerant and restored tolerance (Lm-D30).

