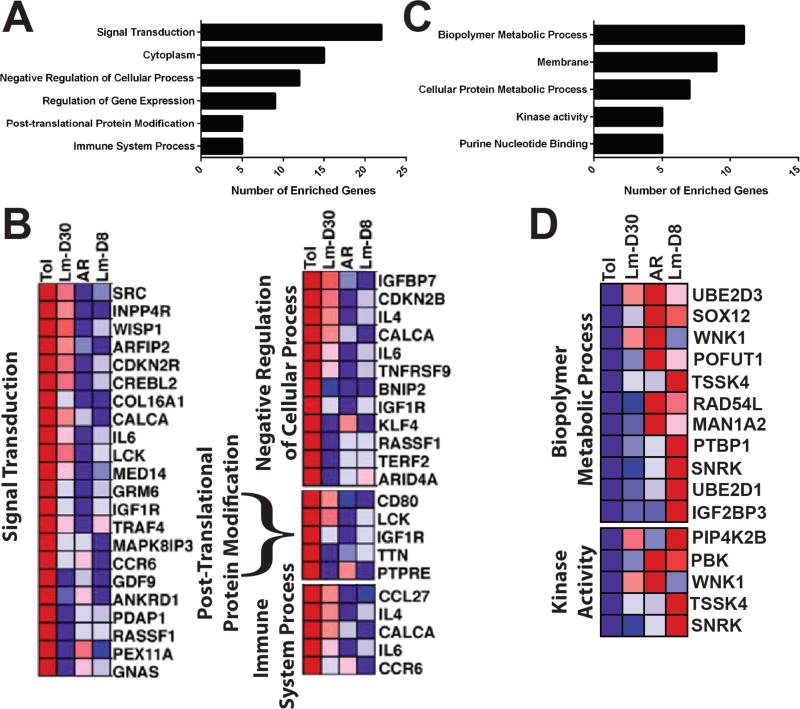
Figure 3.
Microarray analysis of graft infiltrating cells suggests a partial retention of a signature of rejection at day 30 post-Listeria infection. (A-B) Frequency of genes associated with selected Gene Ontology terms and heat map of gene expression derived from the full set of 234 differentially-expressed genes wherein the expression of tolerant genes (Tol) were at least 2-fold higher than in rejection (acute rejection (AR) or loss of tolerance at day 8 post-Listeria infection (Lm-D8)) but ≤ 50% restored at day 30 post-Lm infection (Lm-D30). (C-D) Frequency of genes associated with selected Gene Ontology terms and heat map of gene expression derived from the full set of 100 differentially-expressed genes wherein the expression of tolerant genes was at least 2 fold higher in the AR and Lm-D8 groups as compared to Tol, and was at least 50% higher in the Lm-D30 group than Tol.

