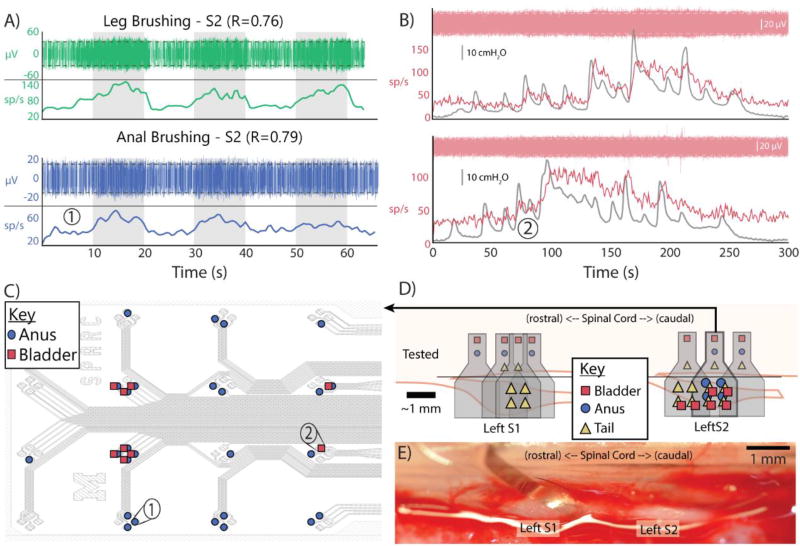
Figure 3.
A) Multi-unit activity recorded on S2 related to leg brushing in experiment 7 (top) and on S2 related to anal brushing in experiment 6 (bottom). Gray rectangles indicate periods of brushing. Titles indicate correlation. Red dashed lines indicate threshold for unit detection B) Multi-unit activity recorded on S2 related to bladder pressure in two trials of same experiment, including raw data, firing rate, and pressure trace. C) Array map of multi-unit activity from one experiment, indicating channels of bottom figures in (A) and (B). D) Map of detected multi-unit activity in one experiment on left S1 and S2. Gray shapes indicate approximate array locations. Colored shapes above black line indicate inputs tested at each array location. Colored shapes over the DRG indicate detected activity by array quartile. E) In vivo surgical image of array on caudal left S1.

