Figure 9.
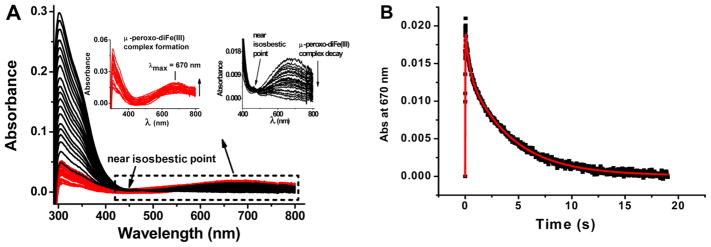
Stopped-flow kinetics of H-rich ferritin. (A) Family of stopped-flow UV–vis spectra for a H-rich ferritin sample with 40 Fe(II) atoms/shell where the increase in the absorbance of the peroxo complex is colored red and its decay black. (B) Absorbance–time curve at 670 nm from the data in panel A. Experimental (black) and simulated (red) curves are shown. The rate constants from the simulation are as follows: k1 = 92.38 ± 5.78 s−1, k2 = 3.17 ± 0.55 s−1, and k3 = 0.24 ± 0.02 s−1. Final experimental conditions after mixing in the stopped-flow apparatus: 2.5 μM H-rich apoferritin saturated with 100% O2, 100 μM FeSO4 (pH 2.0), 50 mM Mops, 25 mM NaCl, pH 7.0, and 25.0 °C.

