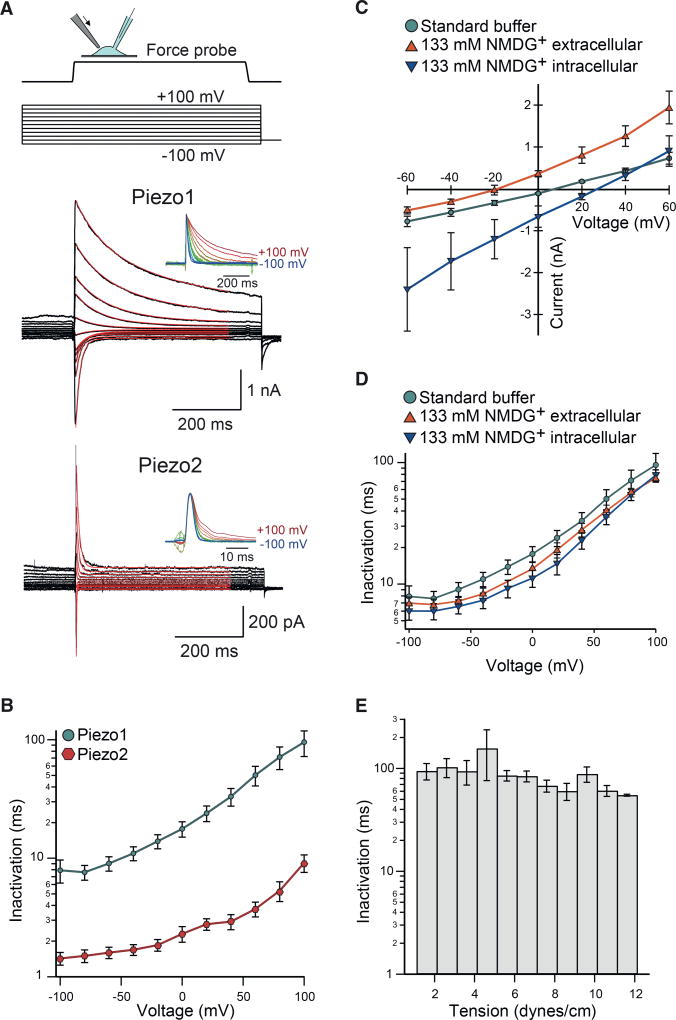
Figure 1. Voltage Modulates Piezo1 and Piezo2 Inactivation.
(A) Force probe indentation (arrow) stimulation protocol and representative currents of whole-cell recordings from HEK293T-P1KO cells transiently transfected with wild-type mouse Piezo1 and Piezo2. Red lines indicate single exponential fits to the decaying currents. Insets show currents normalized to their peak amplitudes.
(B) Mean inactivation time constants obtained from exponential current fits as a function of membrane potential for Piezo1 (n = 13 cells) and Piezo2 (n = 14 cells).
(C and D) Shown here: (C) mean peak currents for Piezo1 during force probe stimulation and (D) mean inactivation time constants from single exponential fits, recorded with standard bath and pipette buffers (n = 13 cells), NMDG+ in the bath (n = 10 cells), and NMDG+ in the recording pipette (n = 9 cells) as a function of membrane potential. See Experimental Procedures for buffer compositions.
(E) Mean time constants of inactivation binned as a function of membrane tension within the patch dome during cell-attached pressure-clamp stimulation from HEK293T transiently transfected with Piezo1 (n = 15 cells).
All data are means ± SEM.

