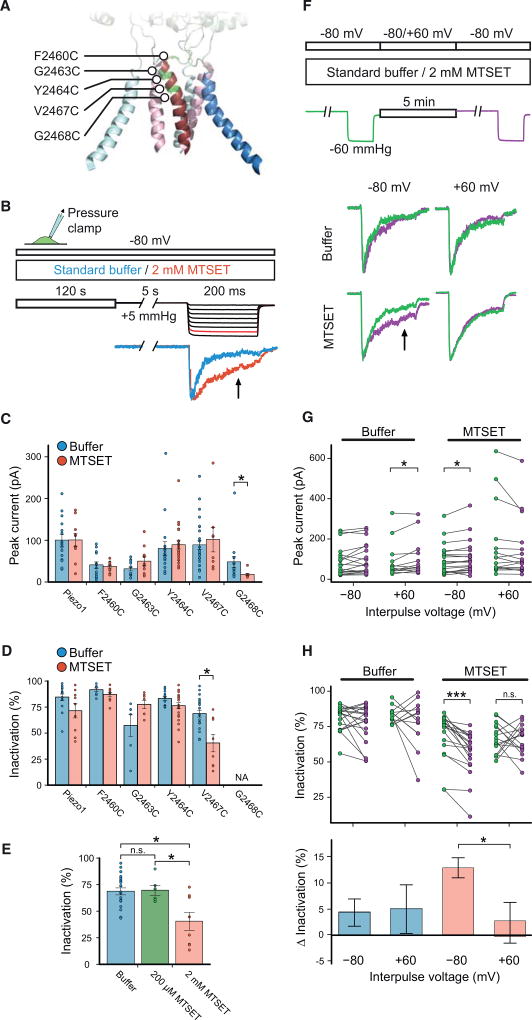
Figure 4. MTSET Has Voltage-Dependent Accessibility to the Upper Pore.
(A) Illustration of Piezo1 pore structure highlighting the outer pore helices (blue), inner pore helices (red), and five residues mutated individually to cysteines for MTSET accessibility experiments.
(B) Pressure-clamp stimulation and MTSET labeling protocol. Cells were held at a constant potential of −80 mV while allowing for 2-min incubation with standard buffer or 2 mM MTSET before testing mechanical activation by a pressure-step protocol (5 s, +5 mmHg prepulse, followed by 200-ms pressure steps from 0 to −70 mmHg). Representative current traces from cell-attached patches of HEK293T-P1KO cells transiently transfected with cysteine point mutant V2467C at the −60-mmHg stimulus step with standard buffer (blue) or MTSET (red). Arrow indicates measured time point of inactivation.
(C and D) Shown here: (C) mean peak currents and (D) mean degree of inactivation of currents from cells stimulated using the protocol in (B) upon application of 2 mM MTSET or buffer alone (n = 8–27 cells; *p ≤ 0.05, unpaired Student’s t test; NA, omitted from analysis).
(E) Degree of inactivation for currents recorded from HEK293T-P1KO cells transiently transfected with cysteine point mutant V2467C stimulated using the protocol in (B) in the presence of standard buffer (n = 20 cells), 200 µM MTSET (n = 6 cells), or 2 mM MTSET (n = 8 cells) (n.s., no significance, p ≥ 0.05; *p ≤ 0.05, unpaired Student’s t test).
(F) Pressure-clamp stimulation and MTSET labeling protocol. Cells were recorded in either standard buffer or 2 mM MTSET by first stimulating with a −60-mmHg pressure stimulus, allowing for MTSET labeling for 5 min at a holding potential of either −80 mV or +60 mV, and immediately following with a second −60-mmHg pressure stimulus. Representative current traces from cell-attached patches of HEK293T-P1KO cells transiently transfected with cysteine point mutant V2467C depicting the first pulse (green) and second pulse (magenta) under indicated MTSET labeling conditions. Arrow indicates measured time point of inactivation.
(G) Individual peak current amplitudes from recordings with the stimulation protocol used in (F) of mutant V2467C with indicated MTSET labeling conditions (n = 13–20 cells; *p ≤ 0.05, paired Student’s t test).
(H) Individual measures of degree of inactivation (top) and mean change in inactivation (below) for recordings of mutant V2467C from (G) (n.s., no significance, p ≥ 0.05; *p ≤ 0.05, unpaired Student’s t test; ***p ≤ 0.0005, paired Student’s t test).
All data are means ± SEM.

