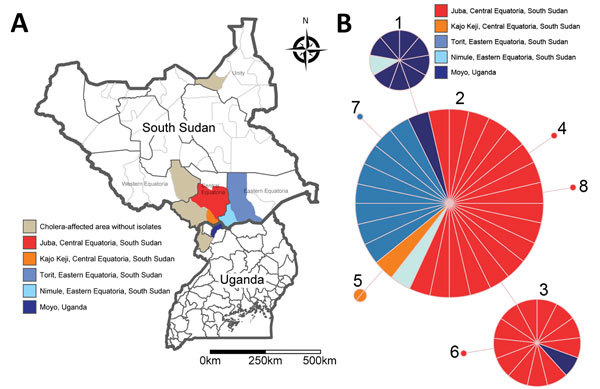
Figure 1.

Locations and molecular analysis of 2014 epidemic in Uganda and South Sudan. A) Affected areas in both countries. Light brown indicates districts where we did not obtain any isolate for molecular analysis; red, orange, and blue areas represent affected districts with cholera isolates included in the analysis. B) Multilocus variable-number tandem-repeat (MLVA) analysis. Minimum spanning tree using pairwise difference was generated using Bionumerics version 6.6 (Applied Maths, Inc., Austin, TX, USA). Circles represent the 8 distinct MLVA profiles we identified, numbered chronologically by the earliest isolate of each profile. The MLVA profiles differ by variations at a single variable-number tandem-repeat locus located in the small chromosome only (VCA 0171, VCA 0283). The size of the circles is proportional to the number of isolates in each profile. Colors represent the location of the isolates and correspond with the colors of the areas in Panel A.
