
Fig. 8.
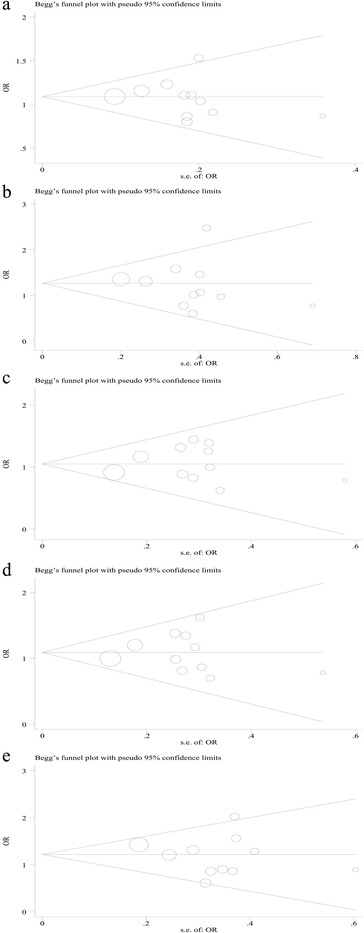
Begg’s funnel plot of publication bias for the association of FAS (rs1800682) polymorphism with MSDD in different genetic models. a Allele model (G vs. A). b Homozygote model (GG vs. AA). c Heterozygote model (GA vs. AA). d Dominant model (GG + GA vs. AA). e Recessive model (GG vs. GA + AA). Each point represents a separate study for the indicated association