Figure 3.

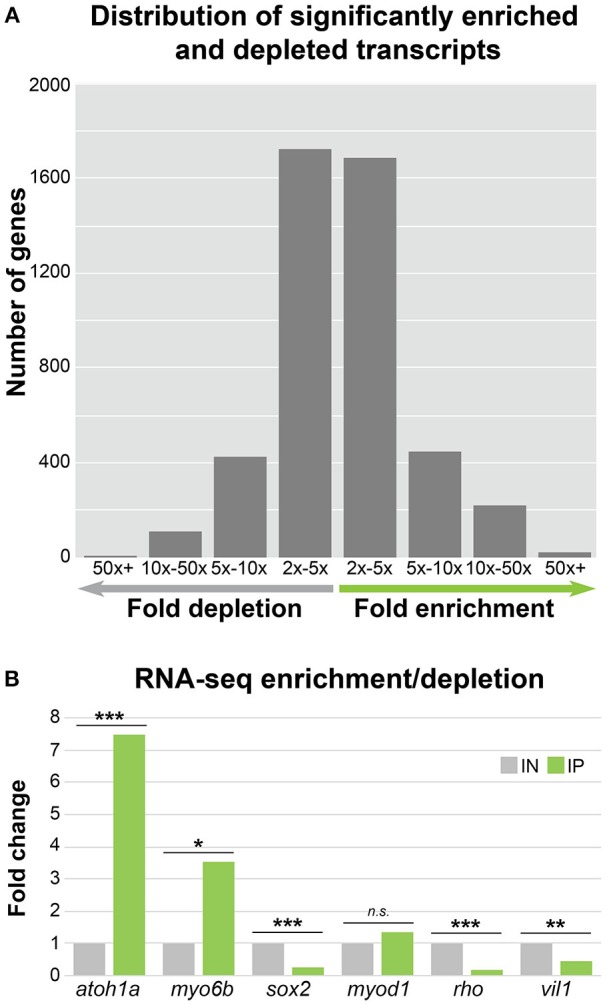
HC ribosome immunoprecipitation can reliably detect HC enriched and depleted transcripts by RNA-Seq. (A) Bar graph showing the distribution of significantly enriched and depleted transcripts in the IN vs. IP samples binned by fold change range. For genes with depleted transcripts in the IP samples, the number of genes per bin is as follows: 2x − 5x = 1726, 5x − 10x = 422, 5x − 10x = 109, and 50x + = 1. For IP enriched gene transcripts, the number of genes per bin is as follows: 2x − 5x = 1685, 5x − 10x = 450, 5x − 10x = 223, and 50x + = 21. (B) RNA-Seq fold change enrichment and depletion of HC expressed and non-expressed genes replicates the results obtained by RT-qPCR (Figure 2C). Statistical significance was assessed using DEseq (see Methods). *FDR < 0.05, **FDR < 0.01, ***FDR < 0.001.
