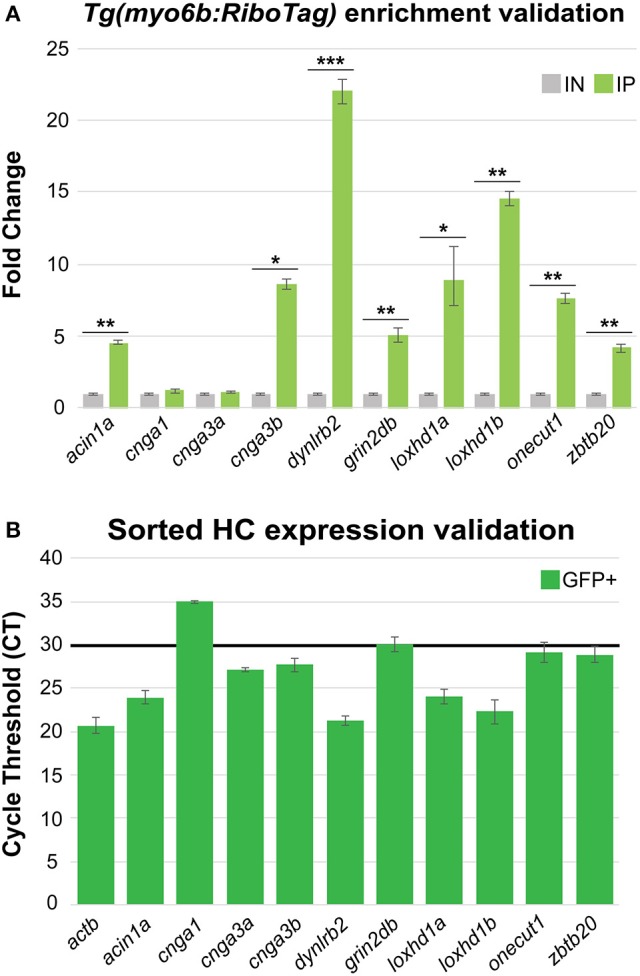
Figure 5.

HC RiboTag immunoprecipitation reveals expression of novel HC expressed genes. (A) Validation of 10 genes found to be highly enriched in HCs from the Tg(myo6b:RiboTag) RNA-Seq using RT-qPCR in independent HC immunoprecipitation (IP) and input (IN) samples. Error bars represent fold change ± standard deviation, and statistical significance was assessed by two-tailed Welch's t-test (n = 3). *p-value < 0.05, **p-value < 0.01, ***p-value < 0.001. (B) Validation of the same 10 highly enriched genes selected from the Tg(myo6b:RiboTag) RNA-Seq in sorted HCs by RT-qPCR. Black bar indicates the cycle threshold (CT) cutoff used to denote reliable expression (CT ≤ 30). Error bars represent CT standard deviation between biological replicates (n = 3).
