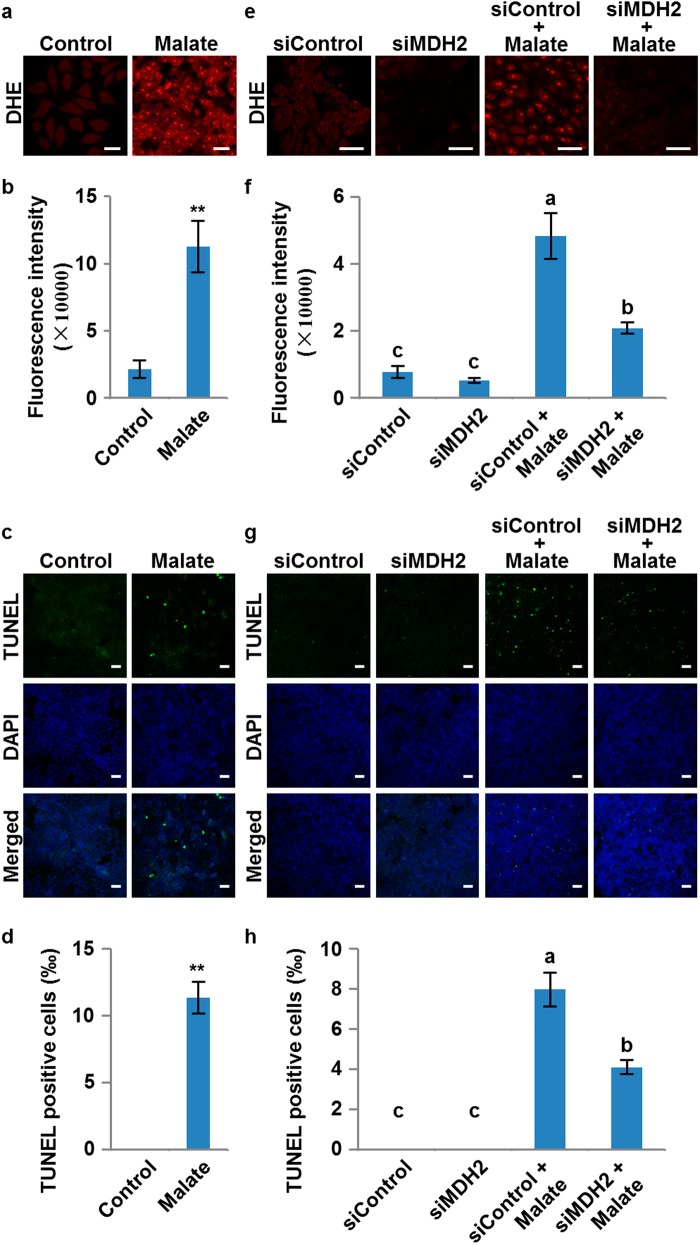
Fig. 7.
ROS induction and cell death triggered by malate in HeLa cells. a ROS levels revealed by dihydroethidium (DHE) staining in HeLa cells with or without malate treatment. Scale bars, 25 μm. b Quantitation of data in a. Values are means ± SD (n = 3) based on 3 independent experiments. The asterisks represent significant difference determined by Student’s t test. **P < 0.01. c Cell death levels revealed by TUNEL staining in HeLa cells with or without malate treatment. Scale bars, 50 μm. d Quantitation of data in c. Values are means ± SD (n = 3) based on three independent experiments. The asterisks represent significant difference determined by Student’s t test. **P < 0.01. e ROS levels revealed by DHE staining in control (siControl) and MDH2 knockdown HeLa cells (siMDH2) with or without malate treatment. Scale bars, 25 μm. f Quantitation of data in e. Values are means ± SD (n = 3) based on three independent experiments, and different letters at top of each column indicate a significant difference at P < 0.05 determined by Tukey’s HSD test. g Cell death levels revealed by TUNEL staining in control (siControl) and MDH2 knockdown HeLa cells (siMDH2) with or without malate treatment. Scale bars, 100 μm. h Quantitation of data in g. Values are means ± SD (n = 3) based on three independent experiments, and different letters at top of each column indicate a significant difference at P < 0.05 determined by Tukey’s HSD test

