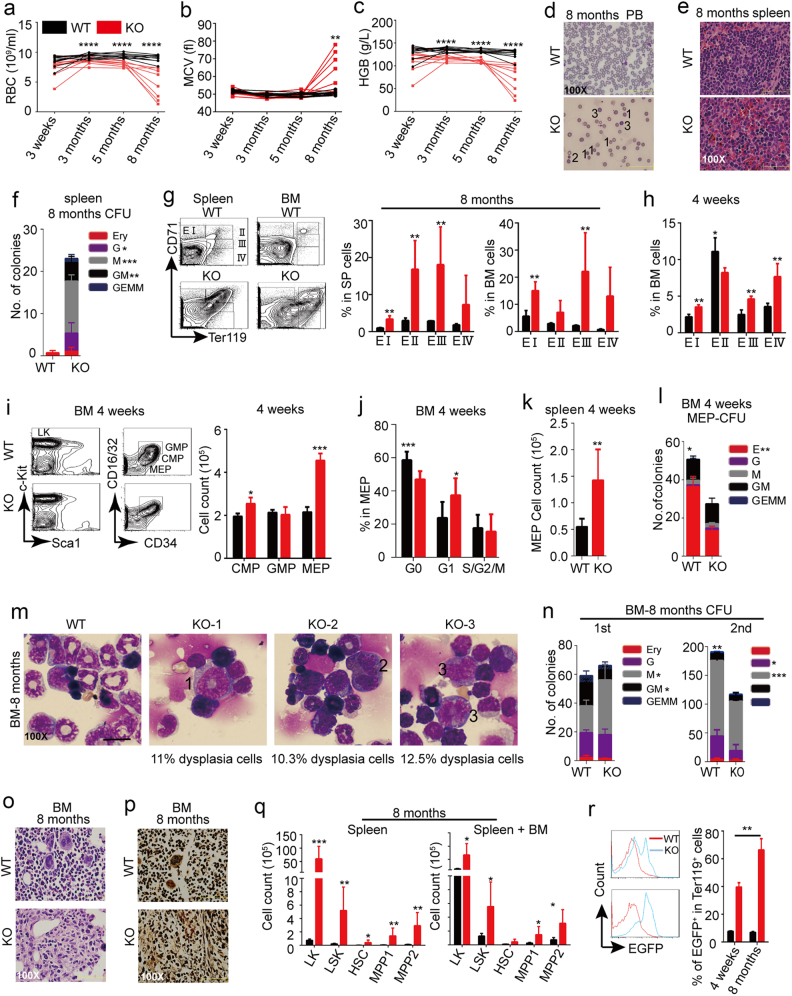
Fig. 3.
Long-term Setd2 deficiency is sufficient to induce MDS-like disease. a–c Routine blood test follow-up. n = 10. d Representative displays of Giemsa staining of blood smears. 1: Howell–Jolly body; 2: Microspherocyte; 3: large spherocyte. e Representative displays of hematoxylin–eosin (HE) staining of spleen tissue sections. f CFU assay of total spleen cells at 8 months after pI–pC induction. n = 3. g Proportion analysis of spleen and BM erythrocytes in different development stages at 8 months after pI–pC induction. n = 3. h Proportion analysis of BM erythrocytes in different development stages at 4 weeks after pI–pC induction. n = 4. i FACS and absolute cell count analyses of BM myeloid progenitor compartments at 4 weeks after pI–pC induction. GMP: CD34+CD16/32+LK, CMP: CD34+CD16/32lowLK, MEP: CD34−CD16/32−LK. n = 3. j Ki67 staining for the detection of MEP cell cycle at 4 weeks after pI–pC induction. n = 9. k Absolute cell count analyses of spleen MEP cells at 4 weeks after pI–pC induction. n = 6. l CFU assay of BM MEPs at 4 weeks after pI–pC induction. n = 3. m Representative display of BM smears. 1: the myeloid cell with megaloblastic change; 2: bilobulated cell; 3: the erythroid cell with megaloblastic change. n CFU assay of total BM cells at 8 months after pI–pC induction. n = 3. o, p Representative displays of HE (o) and silver staining (p) of BM tissue sections. q Absolute cell count of HSPCs in spleen and BM. n = 3. r Proportion analysis of EGFP-positive cells in spleen erythroid cells of WT and KO mice at different ages. *P < 0.05, **P < 0.01, ***P < 0.001, ****P < 0.0001

