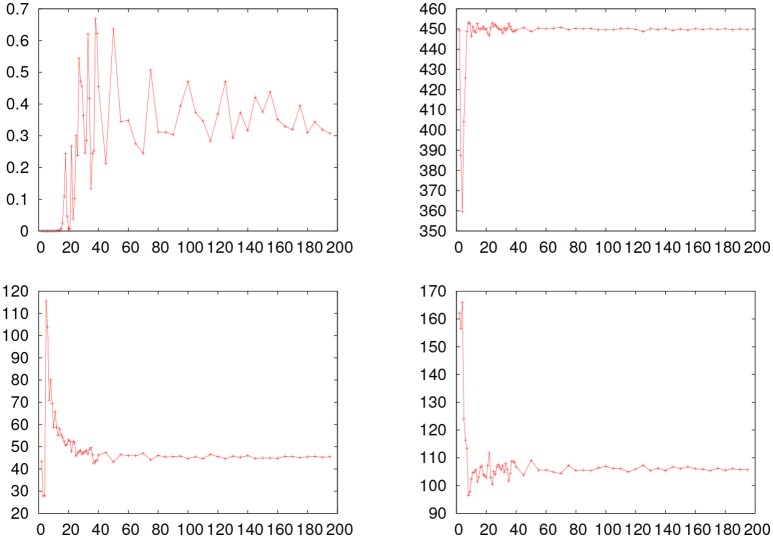
Figure 4.
Fitting results obtained with the minSQR method varying the number of intervals in the histogram for the young_hfgng experiment. The horizontal line shows the value obtained with the maxLKHD method. (Upper left) Evolution of the p probability. (Upper right) Evolution of μ. (Bottom left) Evolution of σ. (Bottom right) Evolution of τ.

