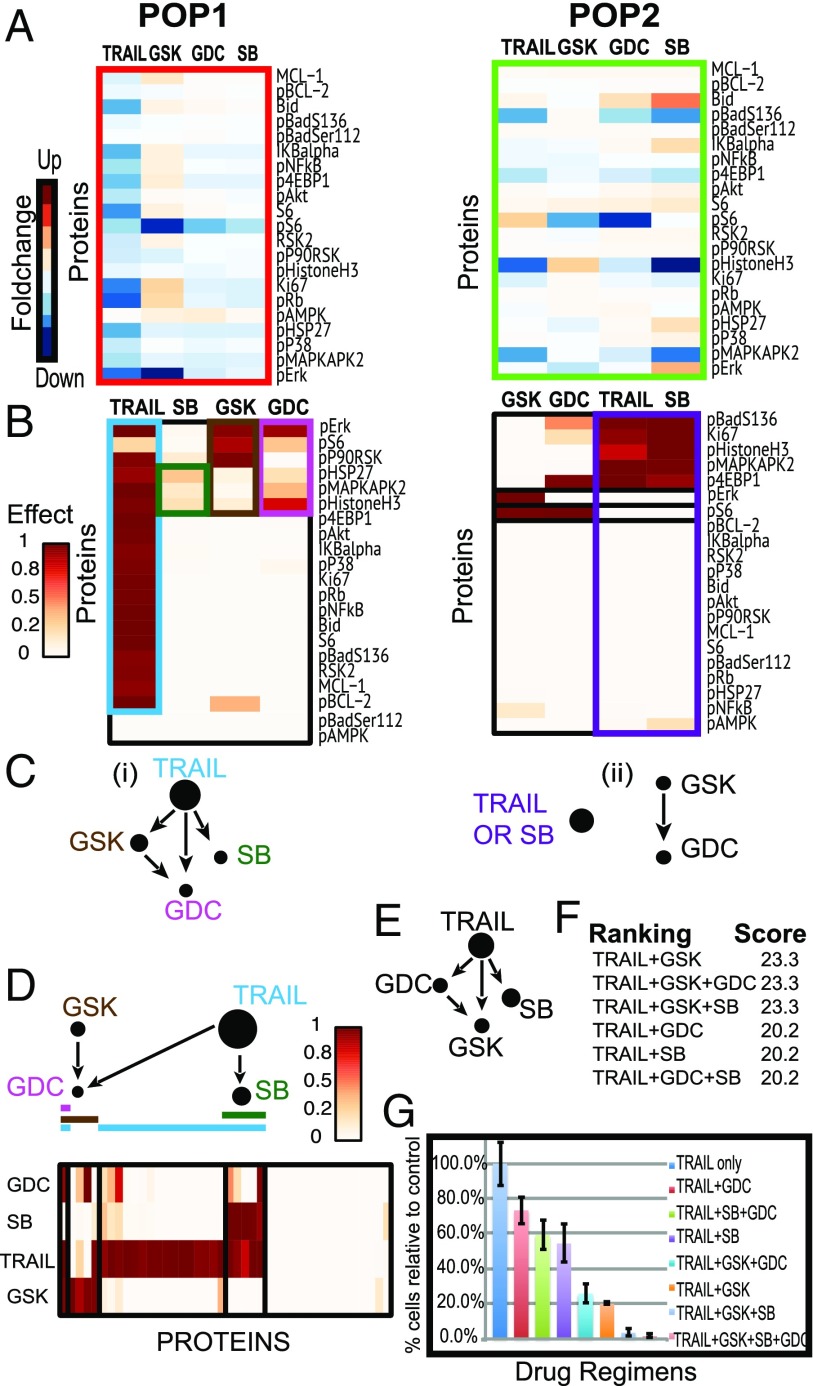
Fig. 4.
DRUG-NEM analysis on HeLa cells. (A) Heatmaps of normalized fold change (FC) of intracellular markers with respect to the baseline across all treatments for two survival subpopulations (POP1–POP2). (B) Heatmaps of probability of effects associated with down-regulation of all intracellular signaling markers. Rows and columns of the effect matrix for each subpopulation have been sorted to show the nested effects across drugs. (C) Drug NEM for each subpopulation. (D) Integrated drug nested effects network (Top) with heatmap (Bottom) of integrated desired effect data across all subpopulations of cells portraying the effects of GDC (pink line) and SB (green line) are a subset of the effects of TRAIL (blue line) and GSK (brown line). Node sizes depict the conditional number of desired effects connected to the associated node. (E) Drug nested effects network with TRAIL on top under a nonheterogeneous model using average desired effects derived from pooling all of the cells in Fig. 3 C, iii. The GSK effects from D not associated with TRAIL have been lost. (F) DRUG-NEM ranking for top-scoring drug combinations with TRAIL. (G) Survival in vitro analysis for several drug combinations involving TRAIL plus GSK, GDC, and SB using clonogenic assays showing that any drug combination including TRAIL and the GSK results in higher cell death levels compared with combinations without these two treatments.

