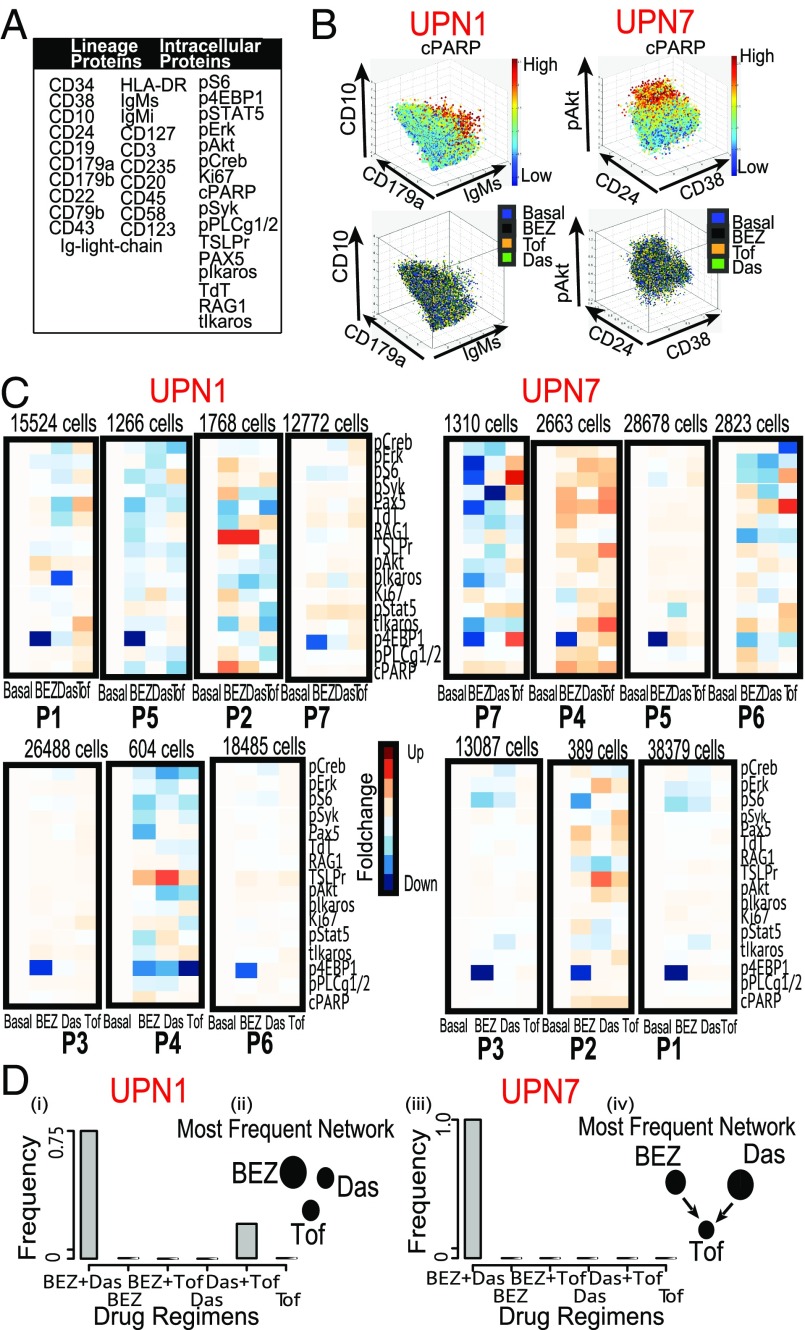
Fig. 5.
DRUG-NEM analysis on two ALL patient samples. (A) Table showing all lineage and nonlineage markers used in the study. (B, Top) 3D scatterplot of pooled UPN1 and UPN7 manually gated cells corresponding to malignant cells derived from gating out potential T and myeloid cells respectively color coded by the cPARP expression. (Bottom) Corresponding distribution of the cells in the top row across all treatment conditions color coded here as blue (Basal), black (BEZ), orange (Das), and green (Tof) showing a random distribution. (C) Heatmaps corresponding to lowly expressed cPARP cells from all seven subpopulations derived using CCAST showing normalized FCs before (Basal) and after treatment. Notice the strong down-regulation effect of 4EBP1 by BEZ across major subgroups. (D) Bar plot showing the distribution of best DRUG-NEM (down FC) predictions for 30 random samples from patients UPN1 (i) and UPN7 (iii), respectively, with the mode on BEZ + Das. The associated dominant DRUG-NEM networks (ii and iv) for both patients are different, and most target effects are associated with BEZ (UPN1) and Das (UPN7), respectively.

