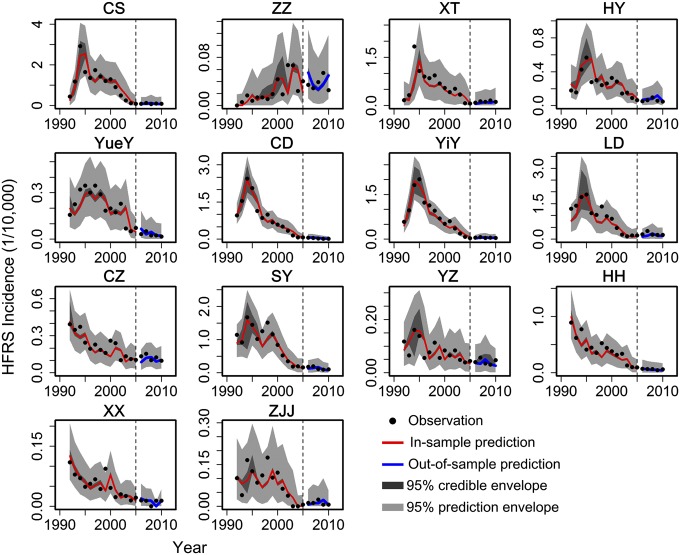
Fig. 4.
The estimated HFRS disease temporal profiles of cities in Hunan Province. The solid lines correspond to the estimated HFRS incidence, and the dark-gray areas correspond to pointwise 95% credible envelopes. The light-gray areas indicate the 95% prediction envelopes for new observations, which account for the estimated observation error. The observed data are plotted as black points, and the red lines represent the in-sample prediction of HFRS incidence. The blue lines represent the out-of-sample prediction of HFRS incidence separated from the simulated HFRS incidence by dashed vertical lines. CD, Chang De; CS, Chang Sha; CZ, Chen Zhou; HH, Huai Hua; HY, Heng Yang; LD, Lou Di; SY, Shao Yang; XT, Xiang Tan; XX, Xiang Xi; YiY, Yi Yang; YueY, Yue Yang; YZ, Yong Zhou; ZJJ, Zhang Jia Jie; ZZ, Zhu Zhou.

