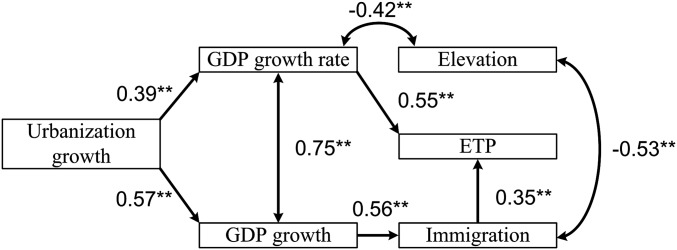
Fig. 6.
Structure and results from our structural equation models for the city-level data: χ2/df = 10.17/5, comparative fit index = 0.90. There is no statistical difference between the predicted and observed covariance matrices (P > 0.05). Double-headed arrows indicate correlations. Straight lines indicate direct relationships. Numbers are standardized path coefficients (55) Gross domestic product growth (purchasing power parity) indicates per capita gross domestic product growth. Gross domestic product growth rate (percentage) indicates per capita gross domestic product growth rate. Immigration indicates number of immigrants. The coefficients of determination for equations of endogenous variables are 0.62 for ETP, 0.32 for immigration, 0.27 for elevation, 0.16 for gross domestic product growth rate, and 0.34 for gross domestic product growth. The structural equation model was implemented by using the R package lavaan with maximum likelihood estimation procedures. GDP, gross domestic product. **P < 0.05.

