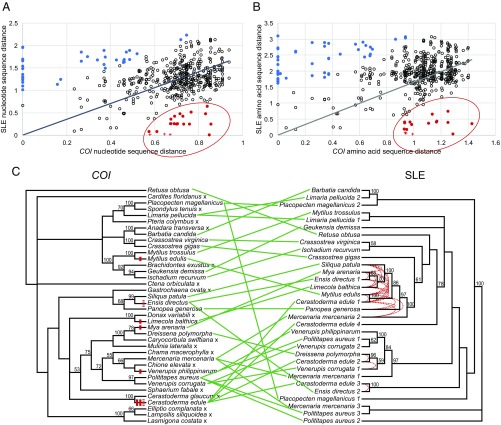
Fig. 1.
Comparison of pairwise distances and phylogenetic trees of SLEs and host mitochondrial DNA. (A and B) Nucleotide sequence distances (A) and amino acid sequence distances (B) are plotted for all pairwise comparisons of bivalve SLE sequences (496) and are compared with the distances of the corresponding host COI [circles and crosses; comparisons between sequences reported in Paynter et al. (16) and Steamer from M. arenaria are marked with a cross]. A linear regression was plotted, and pairwise comparisons in which the SLE sequence was higher (blue) or lower (red) than expected are marked, using 1.5 times the IQR as the cutoff. (C, Left) The host phylogenetic tree was made from the alignment of COI nucleotide sequences (Fig. S1) rooted on the gastropod R. obtusa. (Right) The SLE phylogenetic tree was made from the alignment of amino acid sequences from the RT-IN region amplified by conserved primers, rooted on the Polititapes aureus 2/3/Mercenaria mercenaria 3 sequences. The 21 pairwise comparisons in which the SLE distance was lower than expected in either A or B are marked by red dotted lines. The HTT events predicted by both phylogenetic incongruity and pairwise distance comparison are shown on the host COI tree as red marks (the dotted mark represents a case in which pairwise distance comparison data could support either one or two events). Sequences represent amplified sequences from genomic DNA of 36 bivalve species and R. obtusa as well as a sequence from the C. gigas genome assembly (Table S1). PhyML 3.0 was used to generate the trees, and Dendroscope 3.5.9 was used to generate the tanglegram. An “x” marks a species in which no SLE was identified. The species of origin is listed, bootstrap values above 50 are shown, and nodes with bootstrap support below 25 have been condensed.

