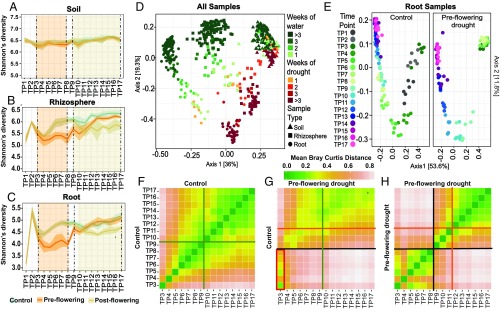
Fig. 1.
Drought impacts root microbiome development. Mean Shannon’s diversity across the soil (A), rhizosphere (B), and roots (C) at each time point under preflowering drought (orange lines), postflowering drought (yellow lines), and control (blue lines) treatments. The shaded areas above and below each line represent standard deviation from the mean. The orange- and yellow-shaded regions demarcated by vertical dashed lines indicate the periods in which preflowering drought and postflowering drought were applied, respectively. (D) PCoA of Bray Curtis distances for all control and preflowering drought samples. Soils (▲), rhizospheres (■), and root samples (●) are indicated. The color of each shape indicates the number of weeks of applied watering (shades of green) or drought treatment (shades of orange and red). (E) PCoA of Bray Curtis distances for all control and preflowering drought root samples colored by time point. Individual time points (TP1–TP17) are represented by distinct colors, with initial time points (TP1–TP2) shown as dark gray (control plot only), early time points (TP3–TP8) shown as shades of green, and late time points (TP9–TP17) shown as shades of blue and purple. (F–H) Heat maps of the mean pairwise Bray Curtis dissimilarity between all root sample replicates within the specified pairs of treatments and time points. A comparison of control samples versus control samples (F), a comparison of preflowering drought versus control samples (G), and a comparison of preflowering drought versus preflowering drought samples (H) are shown. Shades of green and pink represent low and high Bray Curtis distances, respectively. The orange and green lines indicate the mean flowering times in drought and control treatments, respectively, while the black lines represent the rewatering event at the end of drought treatment. (G, Lower Left) Red rectangle highlights the strong similarity between drought-treated samples at TP3–TP8 and the control treated samples belonging to TP3.

