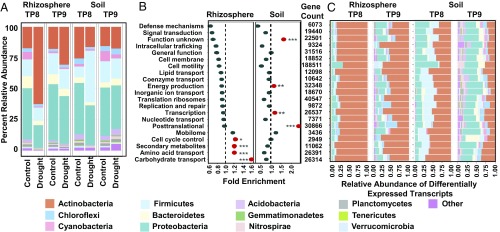
Fig. 4.
Drought impacts root microbiome transcription. (A) Percent relative abundance across the top 13 phyla for all transcripts in the metatranscriptome data for which taxonomies could be assigned from rhizospheres (Left) and soils (Right) for all control and drought-treated samples at TP8 and TP9. (B) GO enrichment analysis for all genes showing enrichment under drought for both rhizospheres (Left) and soils (Right) at TP8. The values on the x axis indicate the fold enrichment ratio of the relative percentages of genes up-regulated under drought in each category relative to the total relative percentage of genes in the corresponding category within the entire dataset. Categories for which there were fewer than five differentially expressed genes were omitted. The red circles indicate categories for which the enrichment had a P value of <0.05 in a hypergeometric test (*P ≤ 0.05; **P ≤ 0.01; ***P ≤ 0.001). (C) Relative abundance across the top 13 phyla for all transcripts for which taxonomies could be assigned and which showed differential expression by treatment from rhizospheres (Left) and soils (Right) at TP8 and TP9, separated according to GO categories (y axis). Categories for which there were fewer than five differentially expressed genes were omitted. The legend for colors used for each phylum is as in Fig. 2.

