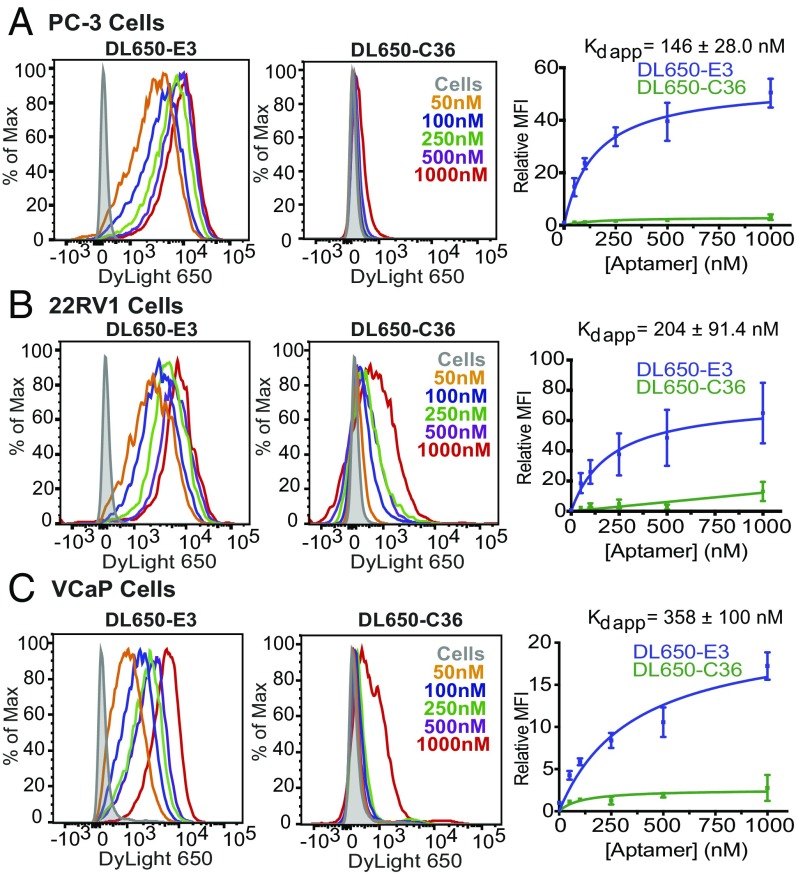
Fig. 2.
E3 targets prostate cancer cells with nanomolar apparent affinity. Flow cytometry analysis of increasing concentrations of DL650-E3 aptamer or DL650-C36 control aptamer incubated with (A) PC-3, (B) 22Rv1, or (C) VCaP cells. Aptamers were incubated on cells for 1 h before washing cells and analyzing by flow cytometry. Binding curves represent data from three independent experiments, with the mean fluorescent intensity of aptamer-treated samples normalized to the mean fluorescent intensity of the cells alone signal.

