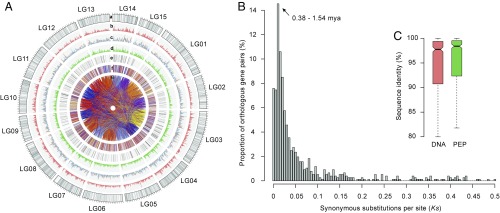
Fig. 1.
Landscape of the tea plant genome. (A) Global view. SNP markers in the genetic map (gray; a); simple sequence repeat density (orange; b); TE density (c; Copia, orange; Gypsy, blue); gene density (green; d); transcription factors (black; e); genes in syntenic blocks between tea and grape (each color for syntenic genes from each grape chromosome; f); and oriented paralogous genes (g). A 1-Mb sliding window was used to calculate the density of different elements. (B) Estimation of divergence time between CSS and CSA using orthologous gene pairs within collinear blocks. (C) DNA and protein sequence similarity of orthologous genes between CSS and CSA. The error bar indicates the maximum and minimum sequence similarity values of orthologous genes.

