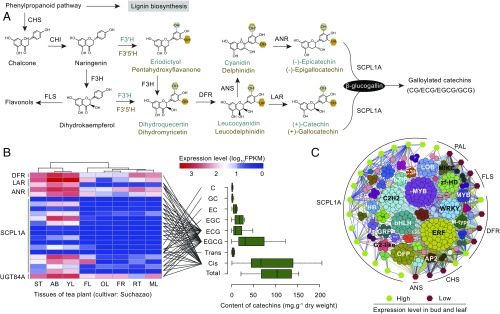
Fig. 3.
Evolution and expression of key genes involved in catechins biosynthesis. (A) Biosynthetic pathway of the principal catechins. CHS, CHI, F3H, F3′H, F3′5′H, DFR, ANS, LAR, ANR, and SCPL represent genes encoding chalcone synthase, chalcone isomerase, flavanone 3-hydroxylase, flavonoid 3′-hydroxylase, flavonoid 3′,5′-hydroxylase, dihydroflavonol 4-reductase, anthocyanidin synthase, leucoanthocyanidin reductase, anthocyanidin reductase, and type 1A serine carboxypeptidase-like acyltransferases, respectively. (B) Expression profiles of key genes in different tissues of the tea plant in relation to their contents of different catechins. (B, Left) Expression levels of key genes associated with catechins biosynthesis in eight tea plant tissues: apical buds, young leaves, mature leaves, old leaves, young stems, flowers, young fruits, and tender roots. Expression data are plotted as log10 values. The horizontal axis of the boxplot (Right) shows statistics of catechins contents from different tissues, and the vertical axis exhibits different forms of catechins. “Cis” represents the contents of cis-flavan-3-ols, and “trans” represents the contents of trans-flavan-3-ols. The significant correlations of gene expression with the contents of ECG, EGCG, and cis-flavan-3-ols are indicated by black lines (Pearson’s correlation test, P < 0.05). The error bar represents the maximum and minimum catechins content in eight different tea plant tissues. (C) Transcriptional regulation of catechins biosynthetic genes. A coexpression network connecting structural genes in catechins biosynthesis with transcription factors represents the regulation of catechins biosynthetic genes. The color-filled hexagons represent the structural genes associated with catechins biosynthesis that was highly (green) or lowly (red) expressed in bud and leaf. Expression correlations between TFs (colored solid circles) and catechins-related genes (colored solid hexagons) are shown with colored lines (Pearson’s correlation test, P ≤ 1e-6).

