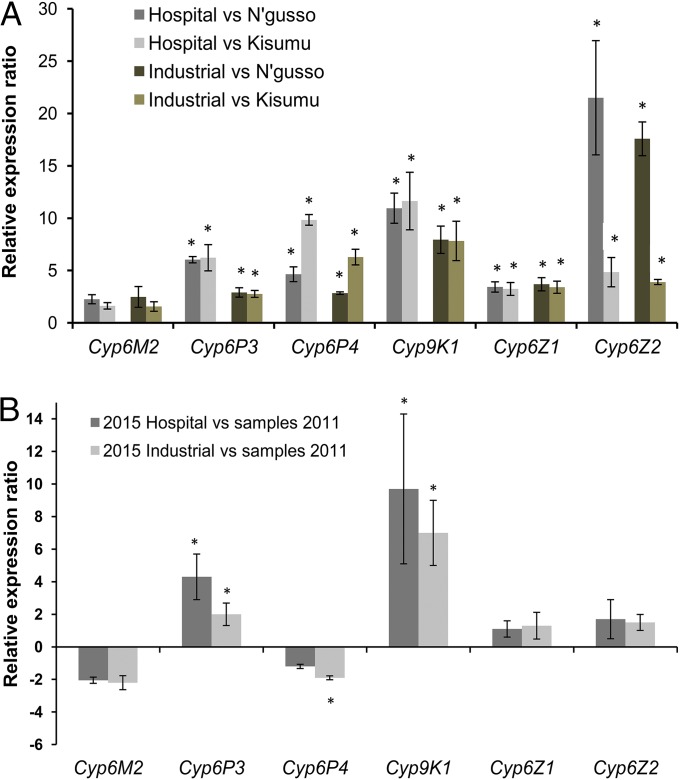
Fig. 4.
Expression analysis of selected P450s by qPCR. (A) qPCR comparisons of selected P450 transcripts between hospital 2015 and industrial 2015 An. gambiae field populations from Bioko vs. the two susceptible laboratory colonies (N’gusso, Kisumu). Error bars represent the SE based on four biological replicates. Asterisk indicates a statistically significant difference in expression levels between the tested samples (Mann–Whitney U test, P < 0.05). (B) Comparison of P450 transcript expression levels between field-caught populations in 2015 (hospital and industrial) vs. samples collected in 2011. Error bars represent the SE based on four biological replicates. Asterisk indicates a statistically significant difference in expression levels between the tested samples (Mann–Whitney U test, P < 0.05).

