Fig. 3.
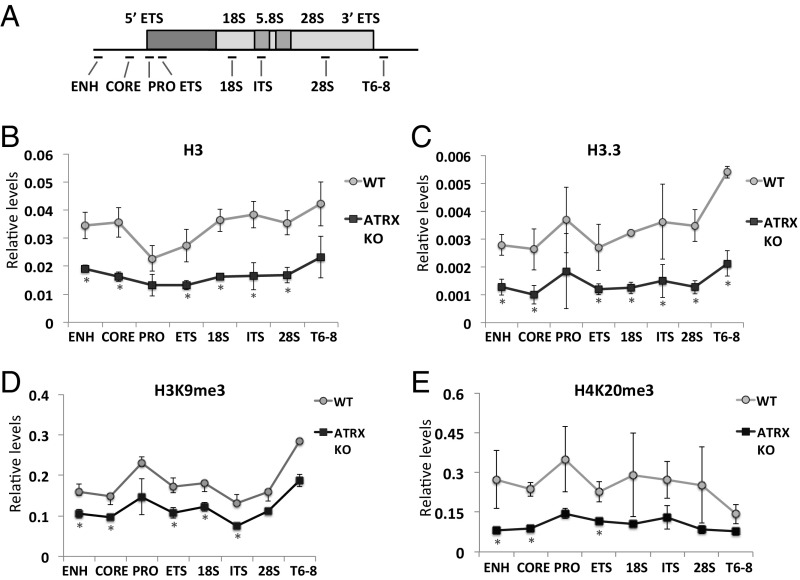
rDNA chromatin state is changed in ATRX KO cells. (A) A schematic diagram of rDNA cluster, showing the locations of various PCR fragments across the region. (B and C) ChIP/qPCR analyses of H3 (B) and H3.3 (C) in WT and ATRX KO (clone KO #1) mouse ES cells showing substantial losses of H3 and H3.3 at the rDNA repeats in the absence of ATRX. (D and E) To determine the levels of heterochromatin present at the rDNA repeats, H3K9me3 (D) and H4K20me3 (E) ChIP/qPCR analyses were performed and normalized to the H3 ChIP/qPCR values, and reductions in both heterochromatin marks, H3K9me3 and H4K20me3, appeared to be significant at a subset of the rDNA repeat loci (error bars represent SD, n = 4, *P < 0.05).

