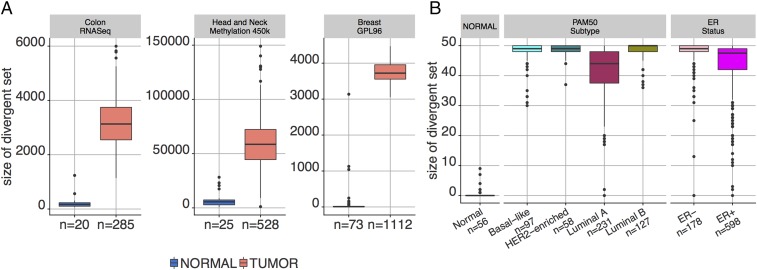
Fig. 2.
Degree of divergence in tumor and normal sample populations. (A) Single features for RNA-seq gene expression, CpG methylation, and microarray expression. (B) The 50 FGSs in MSigDB “Hallmark” collection. Note that, by design, the level of divergence in the normal populations is extremely small. In both cases, divergence is learned from a separate normal population.

