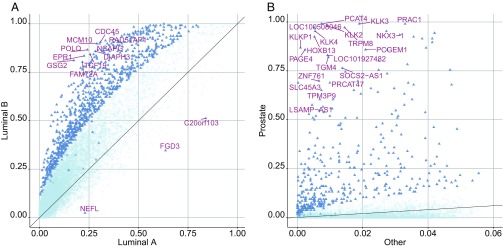
Fig. 3.
Differentially divergent genes between tumor phenotypes. (A) Scatter plot of divergence probabilities of genes for 231 luminal A and 127 luminal B breast cancer samples in TCGA. After Bonferroni correction, 941 genes (blue triangles) have an adjusted P value for a test comparing the two subtypes using ternary digitized data. Among these, the genes with the smallest P values are labeled. (B) Scatter plot of divergence probabilities of genes for 106 prostate and 4216 nonprostate samples in Genotype-Tissue Expression (GTEx) with respect to a nonprostate baseline. After Bonferroni correction, 433 genes (blue triangles) have an adjusted P value in a test comparing the two groups. The 20 genes with the smallest P values and higher divergence probability in prostate are labeled.

