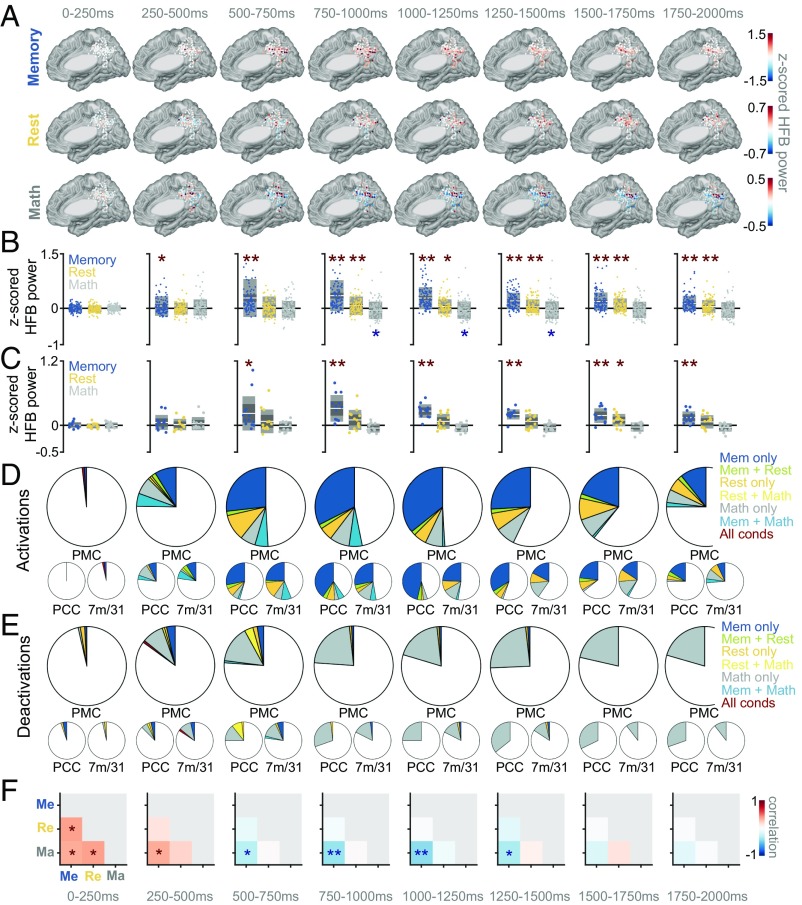
Fig. 3.
(A) Progression of HFB activity in 250-ms time bins at each PMC site, separately for each condition, at all electrode sites across all subjects (transformed to common MNI space). (B) Distribution of HFB power during each time window and condition, across sites (i.e., distribution of data points from A). The center line in each box represents the mean across sites, the extents of the dark gray box represent the 95% confidence interval of the mean, and the extents of the lighter gray box represent one SD of the distribution. Asterisks indicate mean of distribution significantly different from 0 (*P < 0.05, FDR corrected; **P < 0.005, FDR corrected). (C) Average HFB power across electrodes within each subject (i.e., each dot represents a single subject) for a particular condition. Asterisks indicate mean of distribution significantly different from 0 (*P < 0.05, FDR corrected; **P < 0.005, FDR corrected). (D) Fraction of electrodes exhibiting a significant activation in each condition or combination of conditions, separately for each time window (P < 0.05, FDR corrected for number of sites, time windows, and task conditions), for the entire PMC (top), PCC (lower left), or areas 7m/31 (lower right). (E) Same as D, but showing fraction of deactivated rather than activated sites. (F) Correlation of HFB power across sites between each pair of conditions (Me, memory; Re, rest; Ma, math), separately during each time window. Asterisks indicate significant correlation, either positive or negative (*P < 0.05, FDR corrected; **P < 0.005, FDR corrected).

