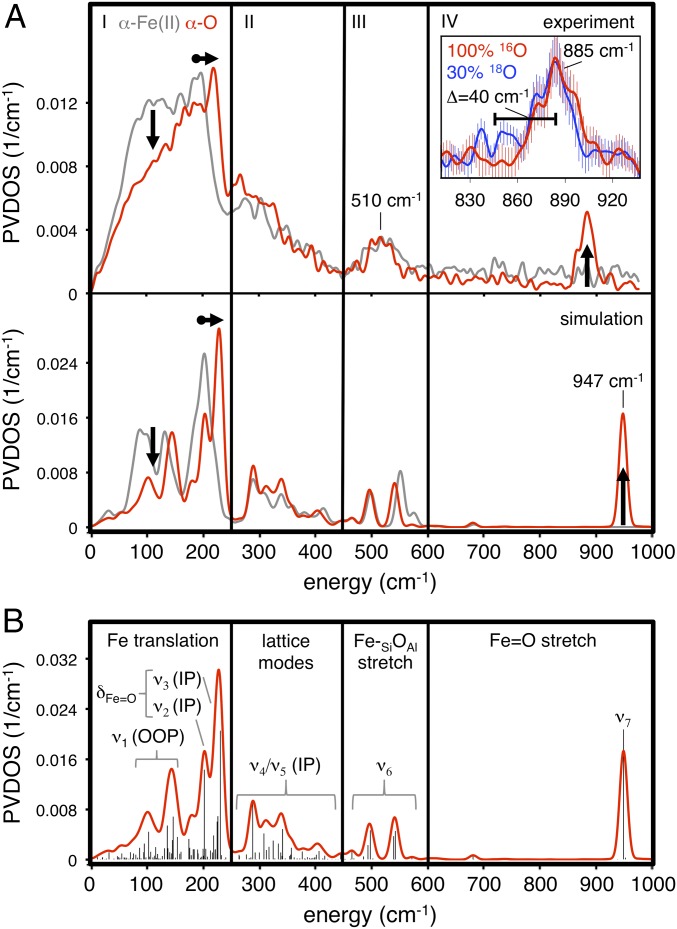
Fig. 6.
(A) Comparison of experimental (Top) and simulated (Bottom) NRVS spectra of α-O (red) and α-Fe(II) (gray), with key changes indicated. The 16O/18O isotope sensitivity of the 885-cm−1 feature is shown (Inset). (B) Simulated spectrum, with assignments to normal modes of α-O shown in Fig. 7.

