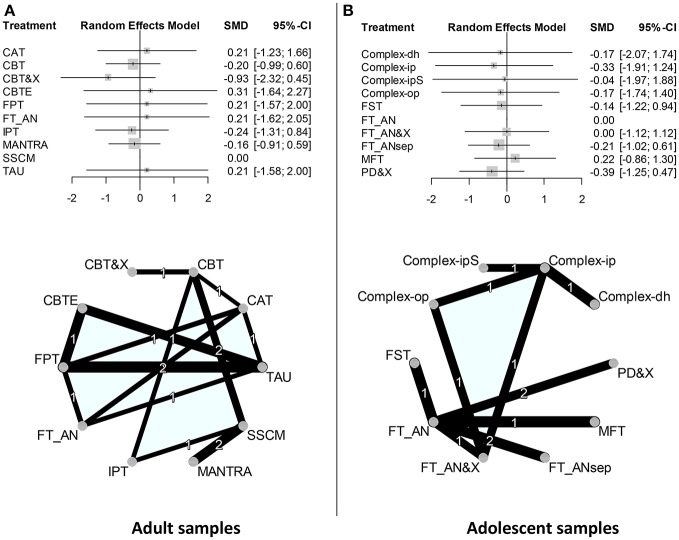
Figure 2.
Forest plots and graphs of network meta-analyses. (A) Forest plot adult samples: SSCM was chosen as the reference treatment. Random effects model. If the 95%-CI includes Zero, then the SMD is not significantly different from Zero. No significant effects. Forst plot adolescent samples: FT_AN was chosen as the reference treatment. Random effects model. No significant effects. Complex-ipS = Complex-ip, “short” inpatient treatment. Net adult samples: All treatment categories are located on a circle in alphabetical order (counterclockwise, starting with CAT). All direct comparisons are represented by a connecting line. Only three direct comparisons were investigated more than once. The thickness of a connecting line is proportional to 1/SE of the respective SMD. (B) Net adolescent samples: FT_AN was chosen as the reference treatment. Only two direct comparisons were investigated more than once.

