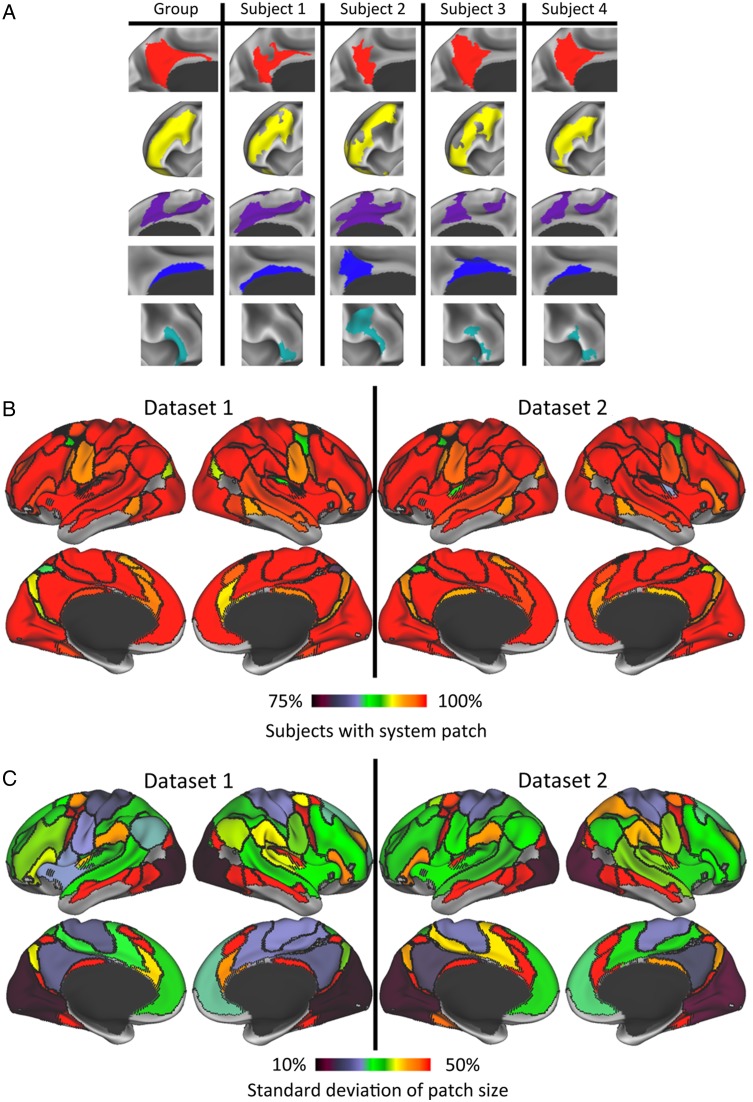
Figure 2.
(A) Examples of matches between group-level system patches (left column) and system patches in 4 individual subjects (right columns). From top to bottom are displayed matched patches in Default, Fronto-parietal, Cingulo-opercular, Medial Parietal, and Ventral Attention systems. (B) Most group average system patches are present in the vast majority of subjects. Group average system patches (see Fig. 1 for systems) are demarcated by black outlines and are colored according to the number of subjects in Dataset 1 (left) and Dataset 2 (right) who had a matching system patch. Orange–red colors indicate that greater than 95% of subjects had a matching patch. (C) Variance in sizes of subject-level system patches, relative to the group-level system patches, was largest in relatively small patches and lowest in primary visual and motor regions. For Dataset 1 (left) and Dataset 2 (right), group-level systems are demarcated by black outlines and are colored according to the standard deviation of the patch sizes, expressed as a percent of the group-level patch sizes. Green and hotter colors indicate that the patch's size variance was greater than 30% of the group patch size.

