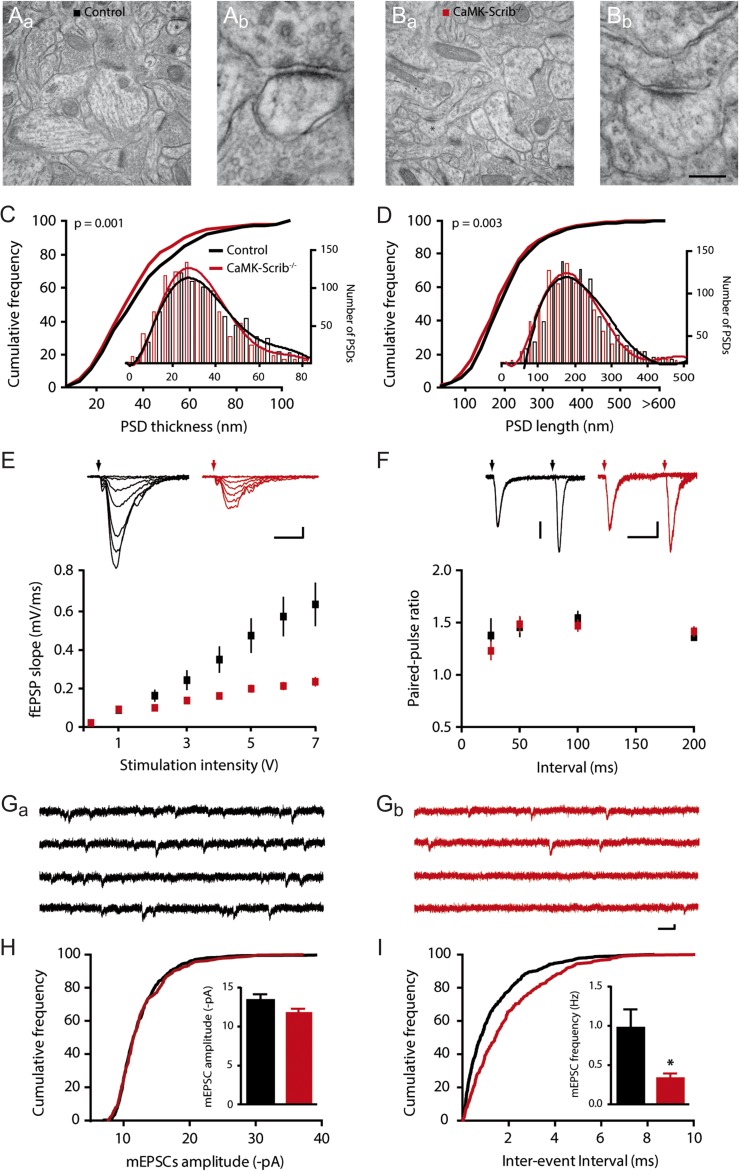
Figure 3.
Reduced number of active CA3-CA1 synapses in CaMK-Scrib−/− mice. (A and B) Representative low magnification electron micrographs of hippocampal CA1 stratum radiatum region of Control (Aa) and CaMK-Scrib−/− (Ba) mice and a higher magnification of a spinous synapse, marked by an asterisks in the respective low magnification panels (Ab and Bb). Scale bar = 588 nm (Aa, Ba) and 88 nm (Ab, Bb). (C and D) Shifted distribution of PSD thickness (C) and PSD length (D) towards smaller PSDs (shorter than 200 nm) in the stratum radiatum of CaMK-Scrib−/− (red) compared to Control (black) (n = 1892/4 mice). Data were compared using Mann–Whitney, P = 0.001 (C) and P < 0.01 (D). (E) Input-output relationship was reduced in CaMK-Scrib−/− slices (red) with respect to Control (black) (n = 12/6, P < 0.0001). Scale bars = 10 ms; 0.2 mV. Data were compared using two-way ANOVA, genotype effect, P < 0.001. (F) Similar PPRs at 25, 50, 100, or 200 ms in Control and CaMK-Scrib−/− slices (n = 6). Scale bars = 50 ms; 50 (Control) and 20 (CaMK-Scrib−/−) µV. Data were compared using Mann–Whitney. (G) Representative mEPSCs traces from Control (Ga) and CaMK-Scrib−/− (Gb) CA1 neurons. Scale bars = 75 ms; 5 pA. (H) Similar average amplitudes of mEPSCs at Control and CaMK-Scrib−/− CA3-CA1 synapses (n = 5). Data were compared using Mann–Whitney. (I) Average frequency of mEPSCs was decreased in CaMK-Scrib−/− compared to Control CA3-CA1 synapses (n = 5). Data were compared using Mann–Whitney, P < 0.05. Data are represented as mean ± SEM.

