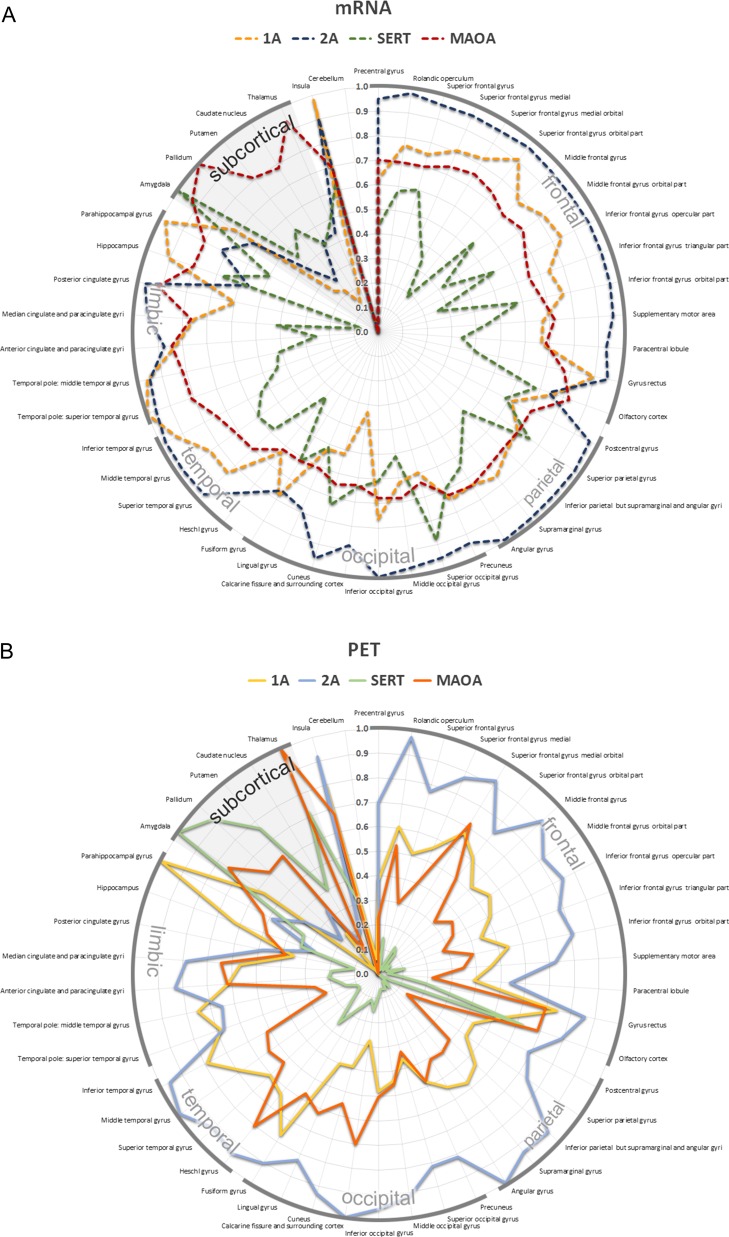
Figure 6.
Topological distribution of the 5-HT1A (yellow), 5-HT2A (blue) receptor, the SERT (green) as well as MAO-A (red) across 46 anatomical regions of interest in the human brain. All values were averaged for the left and right hemisphere. Absolute values of PET binding were normalized for each radiotracer to visualize regional differences of protein distribution. For gene expression, data were normalized between proteins to visualize relative differences of mRNA expression. The radial axis indicates (A) mRNA expression derived from the AHBA (dashed lines) and (B) PET binding (solid lines).

