Figure 5.
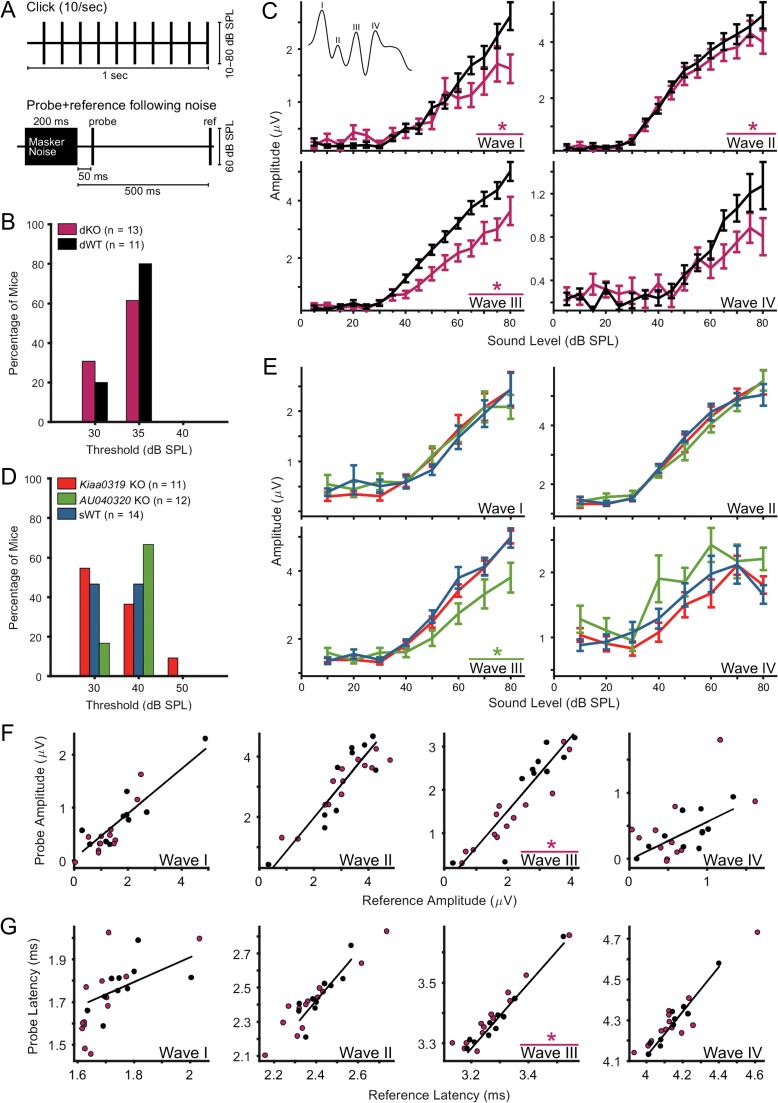
AU040320 single and double knockout mice show suprathreshold alterations in ABRs. (A) Diagrams of stimuli for ABR recordings. Top, clicks presented at 10 clicks/s, used for analysis of click-evoked ABR thresholds, amplitudes and latencies (see B–E); bottom, masker noise followed by probe and reference clicks, used for analysis of effects of preceding noise on click-evoked ABRs (see F,G). (B, D) No differences in click-evoked ABR thresholds between KO and WT animals for any of the groups. (C) ABR wave amplitudes for dKO (n = 13) and dWT (n = 11) mice. Wave I and II amplitudes were significantly reduced (*) in dKO compared to dWT mice especially at higher sound levels (RM-ANOVA (group × sound level) wave I: P = 0.002; wave II P = 0.044). Wave III amplitude in dKO mice was significantly reduced regardless of sound level (RM-ANOVA (group) P = 0.014) (see Table S5). Color key as in (B). Error bars, mean ± SEM across animals. (E) ABR wave amplitudes for Kiaa0319 (n = 11) or AU040320 (n = 12) single KO mice and WT controls (sWT; n = 14). Wave III ABR wave amplitude was significantly reduced in AU040320 KO compared to WT animals (RM-ANOVA (group) P = 0.029); no significant differences in ABR amplitude between Kiaa0319 KO and WT mice for any of the 4 waves (see Table S5). Error bars, mean ± SEM across animals. Color key as in (D). (F, G) ABR wave amplitudes and latencies for dKO and dWT mice in response to a “probe” click 50 ms following the end of a 200 ms, 60 dB SPL noise versus a “reference” click 500 ms after the noise offset (see bottom diagram in A). Scatterplots compare amplitude (F) or latency (G) of ABR waves evoked by probe and reference clicks; solid lines indicate 2D least-mean-squares fits to the WT data. There was a significant difference between dKO and dWT mice in ABR wave III amplitude and latency for probe click relative to reference click (binomial test on number of points above and below the dWT best-fit line; wave III amplitude P = 0.003; wave III latency P = 0.0002). There were no other significant differences between dKO and dWT mice.

