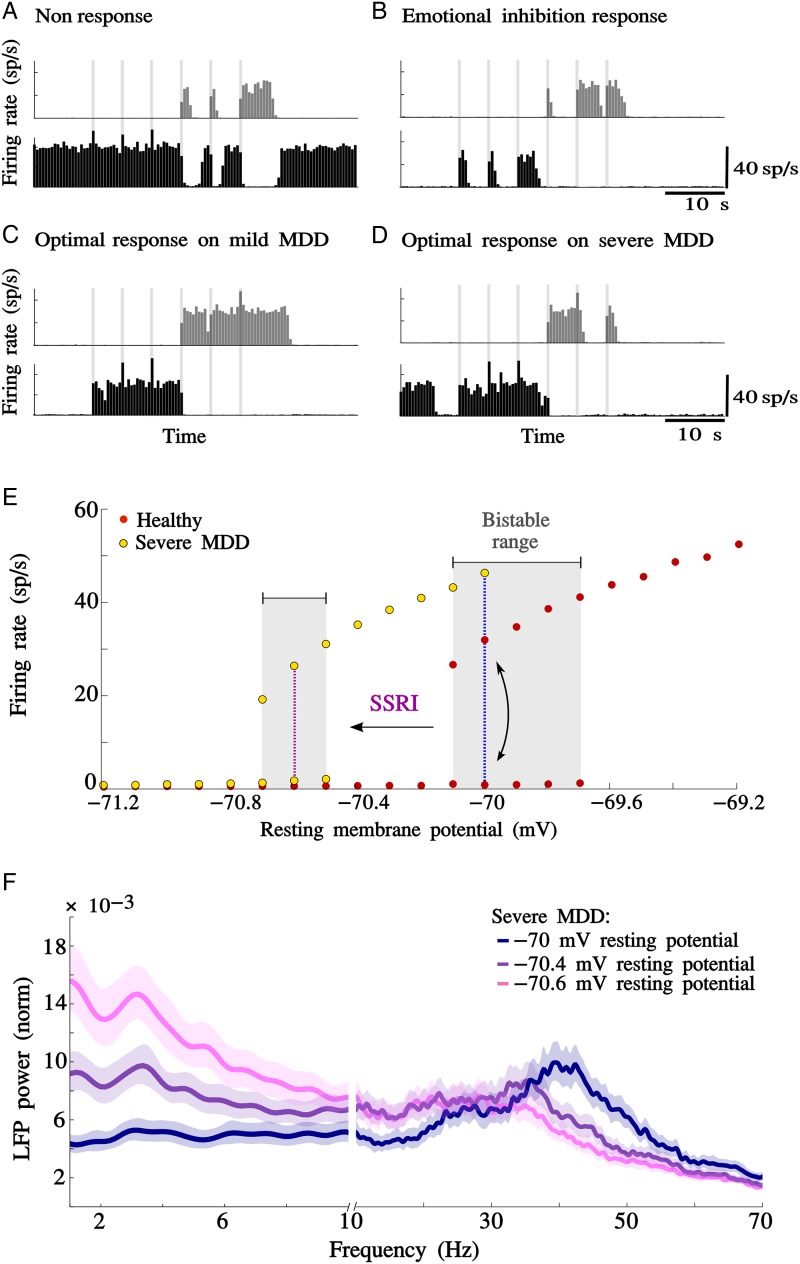
Figure 4.
Serotonin treatment response on MDD network models decreases with the progression of the disease. (A) Nonresponse: A moderate MDD model (5% slow-down in glutamate decay) treated with a low dose of SSRI (VL = −70.05 mV), vACC showed aberrant activity in resting epochs, and dlPFC showed diminished responsivity to cognitive inputs. (B) Emotional inhibition: A moderate MDD model (5% slow-down in glutamate decay) treated with a high dose of SSRI (VL = −70.5 mV); SSRI treatment could turn off aberrant activity in vACC in the resting epoch, but also inhibited the response of vACC to emotional stimuli during the SP epoch. (C) Optimal response on mild MDD model: Mild MDD (2.5% glutamate decay slow-down) treated with an optimized dose of SSRI (VL = −70.18 mV). (D) Optimal response on severe MDD model: Severe MDD (7.5% glutamate decay slow-down) treated with an optimized dose of SSRI (VL = −70.6 mV). (E) Bifurcation diagram for healthy and severe MDD models: Mean firing rate of excitatory neurons over stable active (upper branches) and inactive (lower branches) network states. The red (yellow) dots represent stable states for the healthy (severe MDD) model. The plot shows the existence of a bistable range, in which network function is bistable between the 2 network states. The blue dotted line represents the baseline network's operating regime, which is in the bistable range in the healthy model. For the severe MDD model, the baseline network's operating regime is on the right side of the bistable range, where only the high-rate state (activated state) is stable. The violet dotted line represents the hyperpolarization generated by the SSRI treatment in the optimal response. Note that the reduction in the bistable range in the severe MDD network generates a reduction in the stability of both activated and inactivated states. (F) LFP normalized power spectrum in the vACC of a severe MDD network treated with SSRI. Severe MDD model (7.5% glutamate decay slow-down) treated with progressively increasing doses of SSRI (VL = −70, −70.4, and −70.6 mV). Synchronization in the theta frequency range was progressively enhanced, whereas beta/gamma rhythm amplitude decreased as the dose of SSRI increased. Jackknife error bars around the mean mark the 95% CI.

