Figure 7.
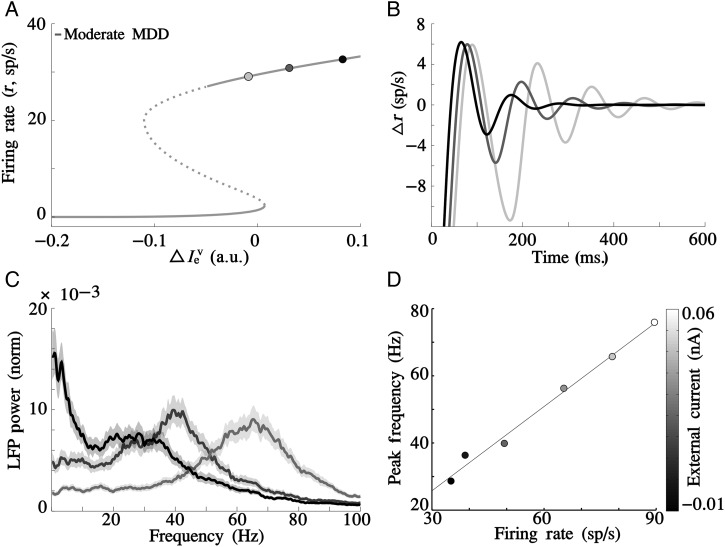
Mechanisms of oscillations. Theta and beta oscillations coexist in the bistable range, but differ in their mechanism. (A) Bistable range for the moderate MDD model (firing rate network, fD = 1.1). We selected 3 network conditions ( = 0.005, 0.02, and 0.08, respectively) in the upper branch, progressively approaching the edge of the bistable range, to illustrate transient dynamics in B. (B) Damped oscillatory dynamics in the theta frequency range were generated by perturbing the steady state (initial condition, = 4 sp/s) of the 3 conditions indicated in A. Damped oscillations had larger amplitude for networks operating near the bistable range limit of the upper branch A. (C) Spiking simulations can present additional high-frequency oscillations. Normalized power spectra of spiking network activity upon progressive depolarization of the vACC excitatory population (depolarizing currents −0.015, 0, and 0.04 nA in ever lighter shades of gray, respectively) in the severe MDD model (spiking network, 7.5% glutamate decay slow-down) revealed changes in the amplitude and frequency of beta/gamma oscillations. (D) The mechanism of high-frequency oscillations in spiking simulations (C) kept a fixed relationship between neuronal firing rate and oscillation frequency, indicating that beta oscillations emerged in the spiking simulations through an oscillator coupling mechanism. Scatter plot shows the frequency of the power spectrum peak in the beta/gamma range versus the network's mean firing rate for a range of vACC depolarizing currents −0.015 to 0.06 nA (grayscale bar).

