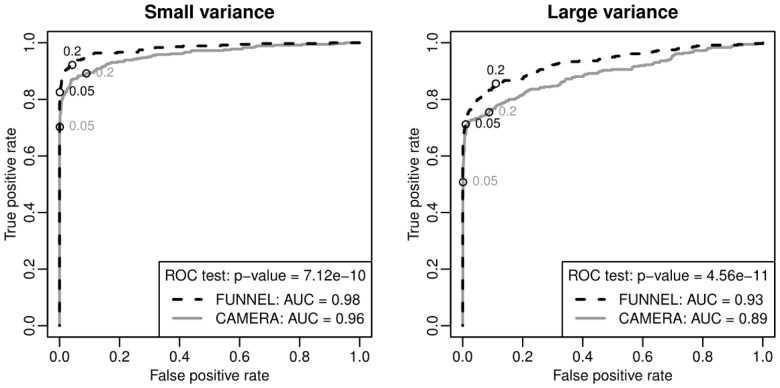
Fig. 3.
ROC curves of FUNNEL (black, dashed) and CAMERA (grey, solid) for different signal to noise levels. ROC curves were plotted for small (left) and large (right) variances in the noise level of the simulated data (see Section 2 for the details). ROC curve of FUNNEL dominates that of CAMERA in both cases. The differences of AUC in both cases are highly significant based on the AUC test

