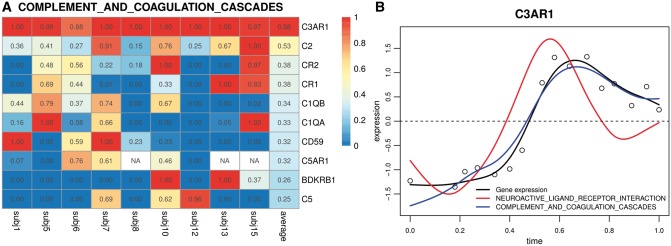
Fig. 5.
(A) Estimated weights. Empirical memberships (weights) of genes in the Complement and coagulation cascades pathway estimated from applying the penalized functional linear regression analysis to all symptomatic subjects. 10 overlapping genes with the largest average estimated weights are shown in this figure. NA cells are due to genes being removed by the non-specific filtering criterion (IQR < 0.3). (B) Temporal expression pattern of C3AR1 (black circles/curve) from Subject 7. This gene belongs to two CP:KEGG pathways: the Neuroactive ligand-receptor interaction (red curve) and Complement and coagulation cascades (blue curve) (Color version of this figure is available at Bioinformatics online.)

