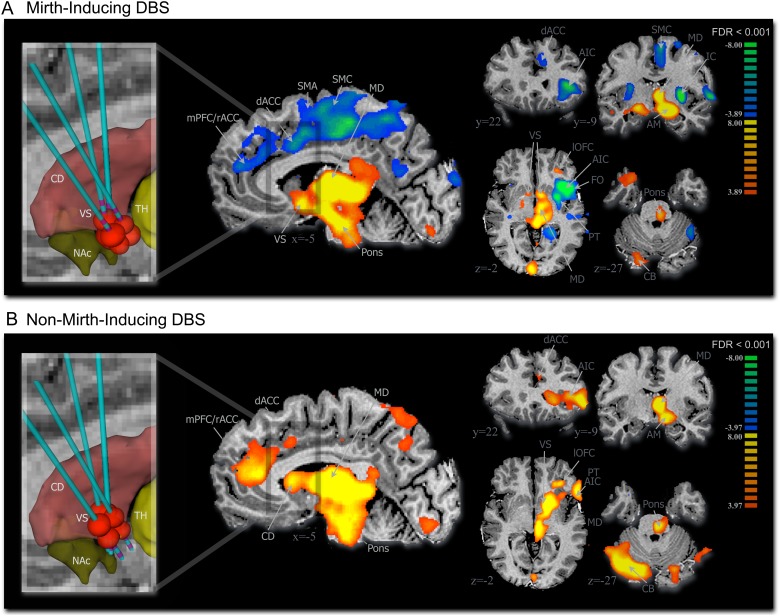
Figure 2.
VC/VS DBS-evoked BOLD signal. (A) Mirth-inducing DBS and (B) non-mirth-inducing DBS (n = 4, 2 runs per subject for each DBS contact configuration) (multisubject analysis, false discovery rate corrected, P < 0.001). Inset shows approximate location of the volume of tissue activated (red ellipsoids) by the active DBS electrode relative to subcortical structures including striatum (red), nucleus accumbens (green), and thalamus (yellow). AIC, anterior insular cortex; AM, amygdala; CB, cerebellum (contralateral); CD, caudate; dACC, dorsal anterior cingulate cortex; IC, insular cortex; MD, mediodorsal thalamus; mPFC/rACC, medial prefrontal cortex/rostral anterior cingulate cortex; NAc, nucleus accumbens; PT, putamen; SMA, supplementary motor area; SMC, sensorimotor cortex; TH, thalamus; VS, ventral striatum.

