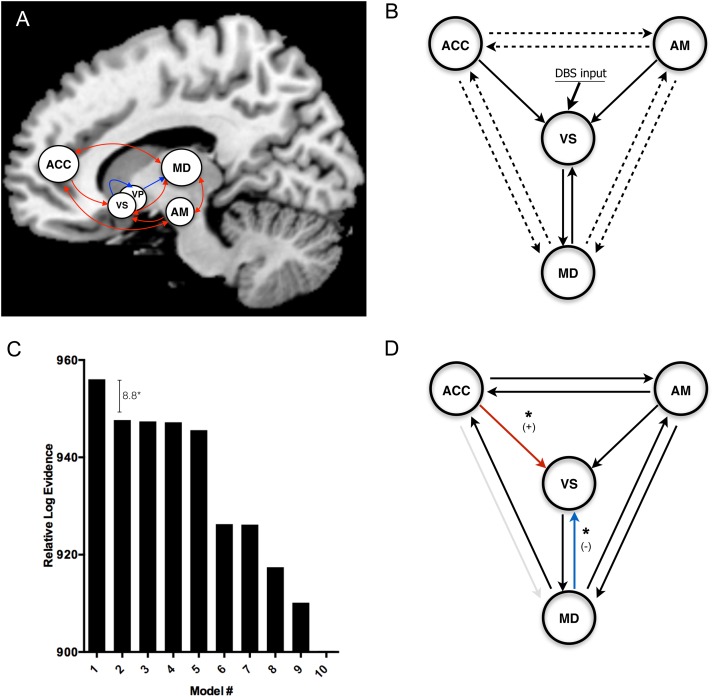
Figure 4.
Dynamic causal modeling. (A) Established connectivity of the limbic cortico-striato-thalamo-cortical (CSTC) loop, with ACC and amygdala projecting to MD thalamus by way of ventral striatum (VS) and ventral pallidum (VP) (excitatory projection = red; inhibitory projection = blue). (B) Simplified limbic CSTC loop that forms the basis of our model space, in which the inhibitory projections from VS to VP to MD are modeled as a single excitatory projection from VS to MD. The arrows represent the anatomical priors that are held constant across model space. For solid arrows, the modulatory effect of DBS is present throughout model space. For dotted arrows, the presence of a modulatory effect due to DBS is varied across model space (128 possible permutations = 128 models). (C) The top 10 models (fixed-effects Bayesian model selection) and their respective log evidences relative to the least likely model. The winning model displayed log evidence of 8.8 greater than the closest competitor, corresponding to a posterior probability of >99.9%. (D) The winning model determined by Bayesian model selection (solid arrows indicate the presence of a modulatory effect due to DBS; red and blue arrows represent connections in which connectivity mirth-inducing DBS exerted a significant enhancement (+) or attenuation (−) of interregional connectivity relative to non-mirth-inducing DBS, respectively (see Supplementary Fig. 5). (*P < 0.05 indicates significant difference between mean interregional connectivity parameters [DCM B Matrix values]: bootstrap random sampling with replacement).

