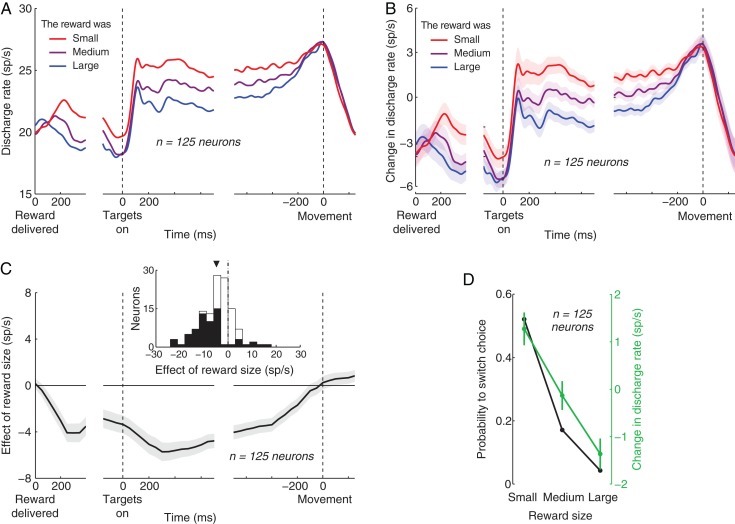
Figure 3.
Parietal activity is strongly modulated by the size of the just received reward. (A) Mean discharge rate of 125 parietal neurons (60 LIP, 65 PRR) as a function of time, separately for the cases in which the immediately preceding reward size (time 0 on the left) was small, medium, or large (same discretization as in Fig. 2). Activity is aligned on the closing time of the valve (left), the onset of the choice targets (middle), and movement (right). The spike time histograms (1 ms resolution) were smoothed using a zero-lag Gaussian filter of standard deviation equal to 20 ms. (B) As in (A) with the exception that the mean discharge rate measured between the time of the reward offset and movement is subtracted from the discharge rate profile of each neuron, before the rates are averaged over the neurons. A similar result is obtained when the activity is divided by the mean rate. The shading represents the SEM over the 125 neurons. (C) Mean ± SEM slope of the line fitted to the relationship between the discharge rate and the normalized reward size. The discharge rate was measured in 300 ms windows sliding through the trial in 50 ms steps. The slope was computed in each of these windows. The reward size was normalized between 0 (2.5 percentile) and 1 (97.5th percentile). The inset shows the slope for the discharge activity measured between the time of the target onset and the go cue, separately for each neuron. The filled parts of the histogram represent neurons in which the slope was significant (P < 0.05, t-statistic). The triangle denotes the mean of the distribution. (D) Comparison of the the effects of reward size on the choice behavior (black; same as in Fig. 2A) and the parietal activity (green). As in the inset in (C), the discharge rate was measured between the time of the target onset and the go cue, and was normalized for each cell in the same way as in (B). The error bars represent the SEM; the black error bars are smaller than the symbols indicating the data points.

