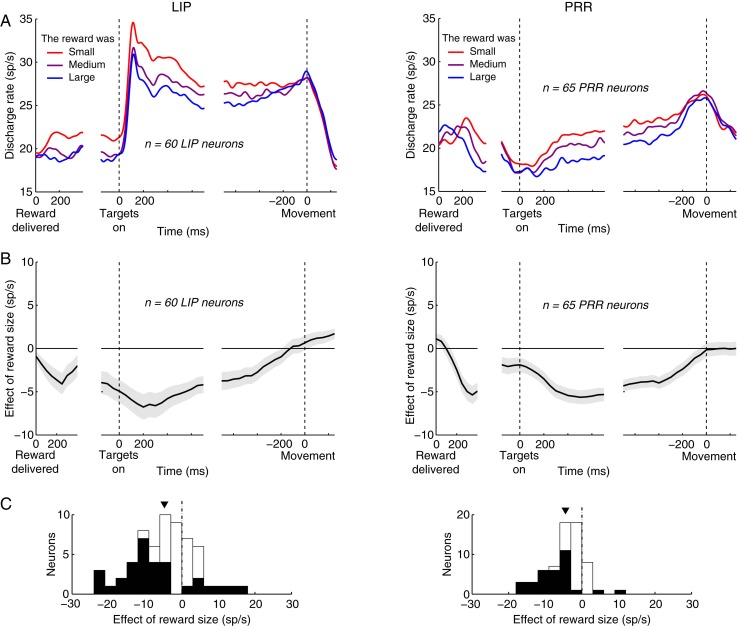
Figure 4.
The effect of reward size in two regions of parietal cortex. Same analyses and similar format as in Figure 3. The histograms are now shown in a separate (C). The (B,D) of Figure 3 are not present in this figure. The data are displayed separately for area LIP (left column) and PRR (right column).

