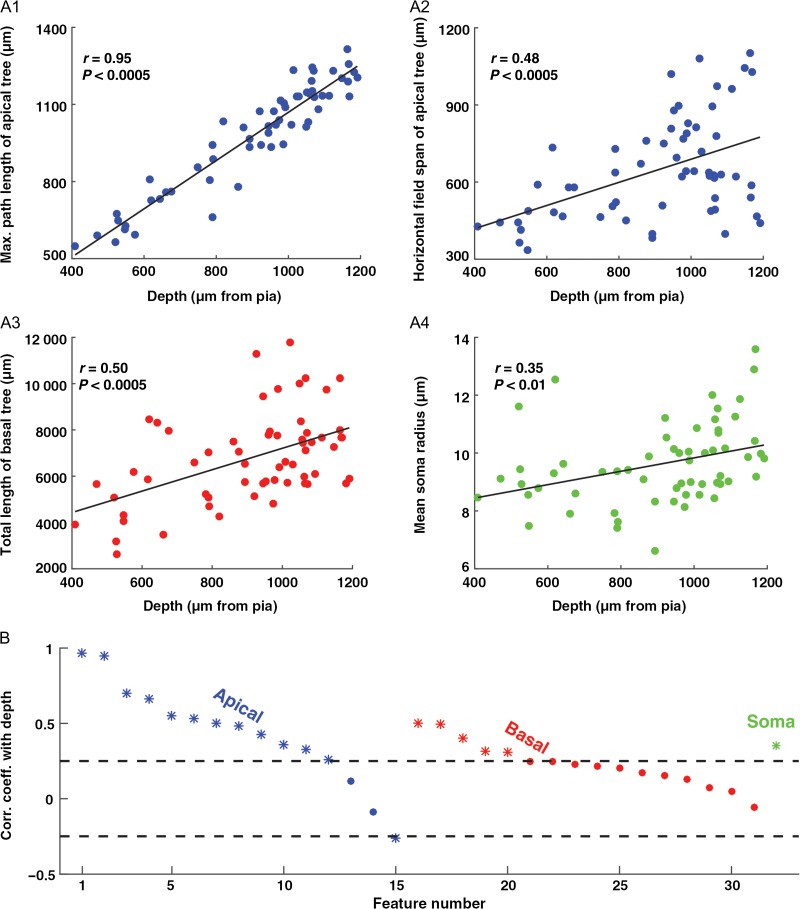
Figure 2.
Many of the morphological features of HL2/L3 PCs display a gradual depth-dependent change. (A1–A4) Four representative features that showed a gradual depth-dependent change. The continuous line is the linear regression fit. (B) Correlation coefficient for all 32 features with depth. The features are separated into 3 groups: apical tree features (#1–#15, blue), basal tree features (#16–#31, red), and a single somatic feature (#32, green); see Table 2 for feature definitions. In each group, the features are sorted in descending order according to the correlation coefficient value with depth. Features with a significant correlation coefficient (P < 0.05) are marked with an asterisk (outside the dashed lines).

