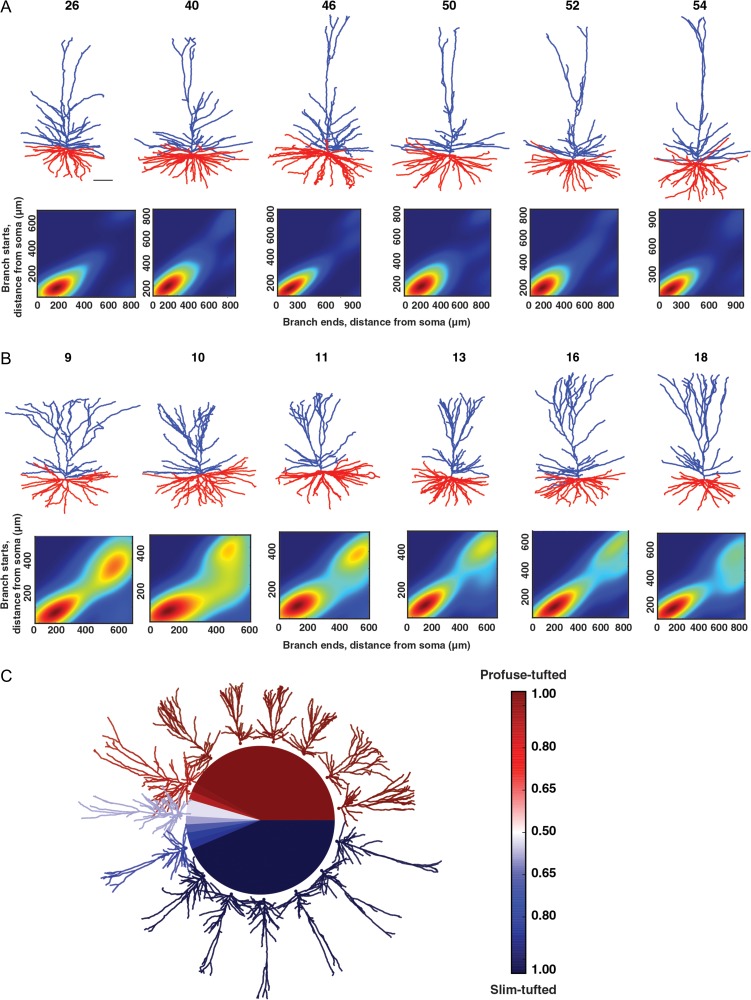
Figure 4.
Examples of the 2 classes (“slim-tufted” and “profuse-tufted”) in HL2/L3 PCs. (A) Top, six 3D reconstructed exemplars of a slim-tufted HL2/L3 cell, cell numbers are as in Figure 1. Scale bar is 100 μm. Bottom, density plot of the cells on top (see “Materials and Methods” section). (B) Top, six 3D reconstructed exemplars of the profuse-tufted HL2/L3 cell, cell numbers are as in Figure 1. Bottom, density plot of the cells on top. (C) Illustration of the separation of the 2 classes. The colors represent the probability of each neuron to be classified as a certain type: dark blue indicates slim-tufted; dark red indicates profuse-tufted.

