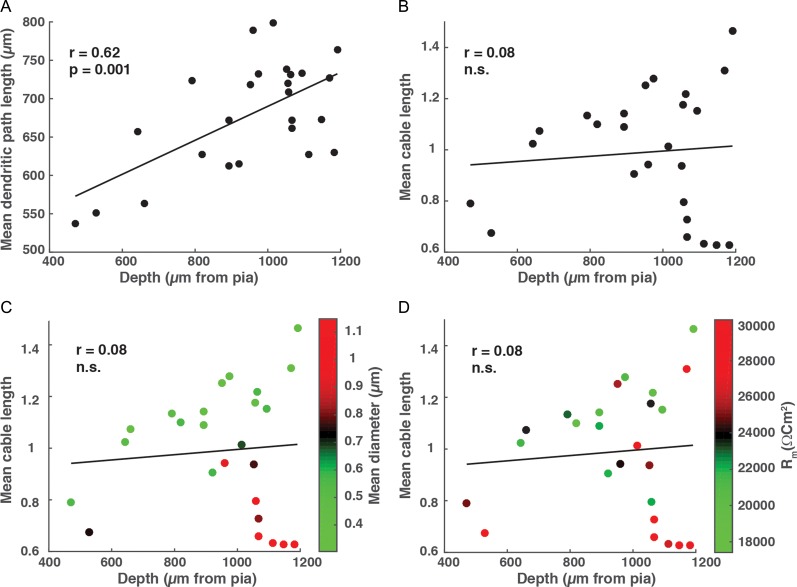
Figure 7.
Physical and electronic length of HL2/L3 PCs. (A) The mean physical length of all dendritic paths as a function of depth. (B) The mean cable length of all paths as a function of depth; this length was calculated assuming Ri = 200 Ωcm, Cm = 0.5 μF/cm2 whereas τm was extracted for each cell from its experimental transients (Fig. 5B, inset). (C) Same as in B, but neurons are colored according to their mean diameter. Note the group of deep cells with large diameters (red circles). (D) Same as in B but neurons are colored according to their respective Rm values. Note the deep cells with large Rm (red circles).

