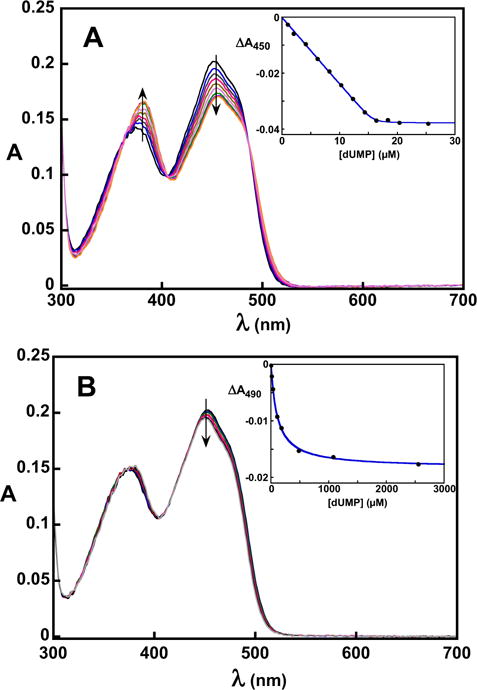
Figure 3.

Spectrophotometric titrations of WT (A) and R174A (B) FDTS with dUMP in 0.1 M Tris-HCl, pH 8 at 25 °C. The insets show the change in absorbance as a function of ligand concentration. The spectral change for dUMP binding to R174A FDTS was noticeably different from other FDTS variants. Fitting to Eq. 1 gives a Kd of 30 nM for dUMP binding to WT FDTS. Fitting to a square hyperbola gives a Kd of 109 μM for dUMP binding to R174A FDTS.
